
Figure 4. Met diminishes DCA-induced protective autophagy.
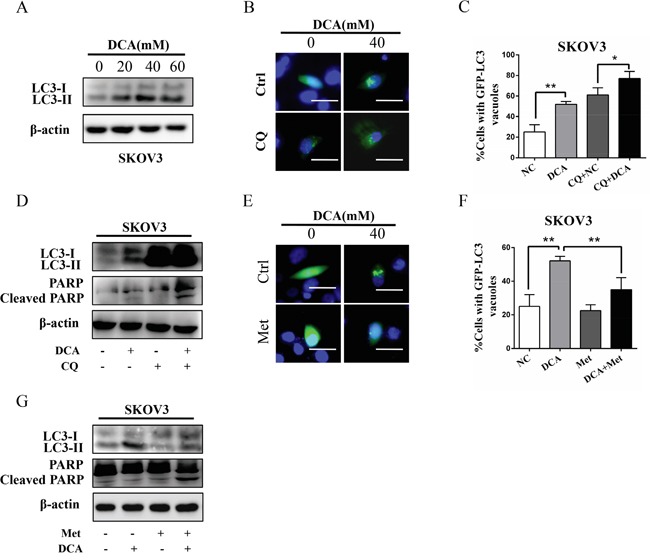
A. SKOV3 cells were treated with the indicated concentrations of DCA, and then the levels of LC3B-I/II were detected by Western blot. B, C. After transfected with GFP-LC3 expressing plasmid for 12 h, SKOV3 cells were treated with 40 mM DCA for another 24 h in the presence or absence of the autophagy inhibitor CQ (20 mM). Then the green fluorescent GFP-LC3 punctas (which occurred upon autophagy induction) were observed under fluorescent microscope (B). Subsequently, the data from (B) was quantified and expressed as the percentage of the cells containing 5 or more GFP-LC3 punctas (C). D. SKOV3 cells were treated with 40 mM DCA for 24 h in the presence or absence of the CQ (20 mM), and then the levels of LC3-I/II and cleaved PARP were examined by Western blot. E, F. After transfected with GFP-LC3 expressing plasmid for 12 h, SKOV3 cells were cotreated with 40 mM DCA and 10 mM Met or each alone for 24 h. Then the green fluorescent GFP-LC3 punctas were photographed (E) and quantified (F) as in (B and C). G. SKOV3 cells were cotreated with 40 mM DCA and 10 mM Met or each alone for 24 h, and then the levels of LC3-I/II and cleaved PARP were detected by Western blot. *,P<0.05; **,P<0.01.