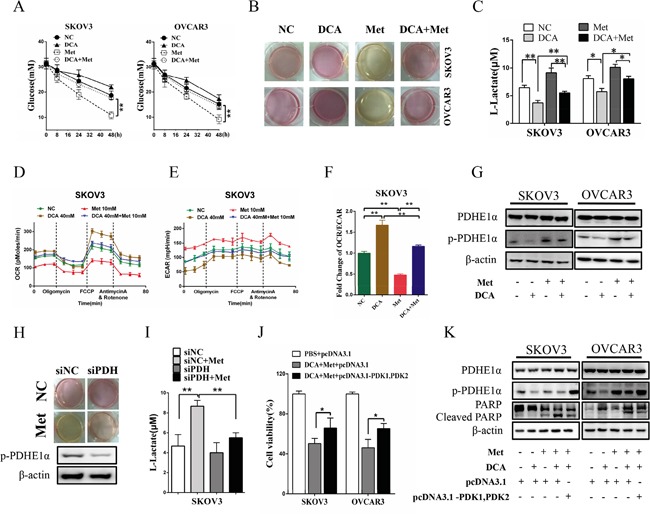
Figure 5. DCA alleviates Met-induced glucose consumption and lactate production.

A. SKOV3 and OVCAR3 cells were cotreated with 40 mM DCA and 10 mM Met or each alone for the indicated times, and then the concentrations of glucose in the culture media were measured separately. B, C. After cotreatment with 40 mM DCA and 10 mM Met or each alone for 24h, the color of the culture media were photographed (B), and the concentrations of L-lactate in the media were assayed (C). D-F. After treated as in (B), the OCR (D) and ECAR (E) of the cells were measured by XF Cell Mito Stress Test Kit, and the mitochondrial respiration rate (OCR/ECAR) was calculated (F). G. The cells were treated as in (B), and then the levels of total PDHE1α and p-PDHE1α on Ser293 were detected by Western blot. H, I. After transfected with the siRNA for PDH or control siRNA for 12h, SKOV3 cells were treated with 10mM Met or PBS. Then the color of the culture media were photographed (H), and the concentrations of L-lactate in the media were assayed (I). J, K. After cotransfected with PDK1 and PDK2 expression vectors (pcDNA3.1- PDK1, PDK2) or control vector pcDNA3.1 for 12 h, the cells were cotreated with 40 mM DCA and 10 mM Met for another 24 h. Then the cell viability was determined by CCK8 assay (J), and the levels of total PDHE1α, p-PDHE1α on Ser293 and cleaved PARP were analyzed by Western blot. siNC, siRNA for negative control; siPDH: siRNA for PDH; *,P<0.05; **,P<0.01.
