
Figure 5. The effect of PDTC treatment on liver inflammatory signaling and protein synthesis in ApcMin/+ mice.
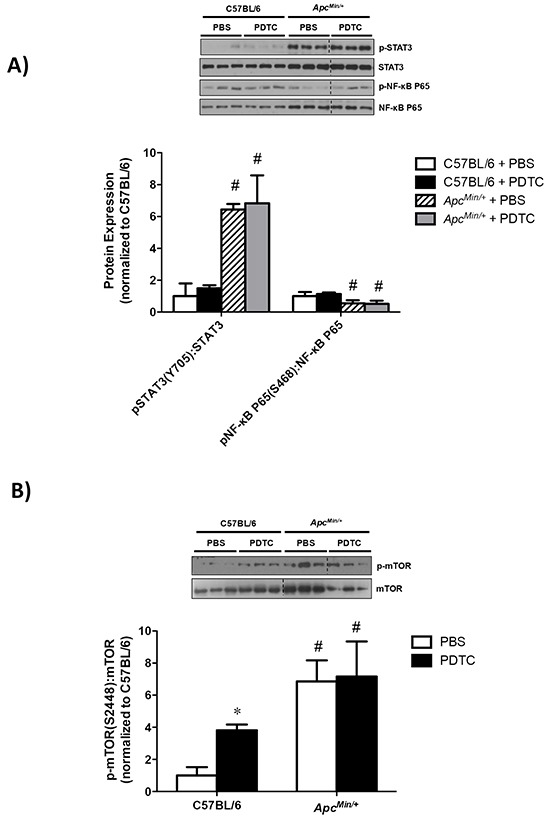
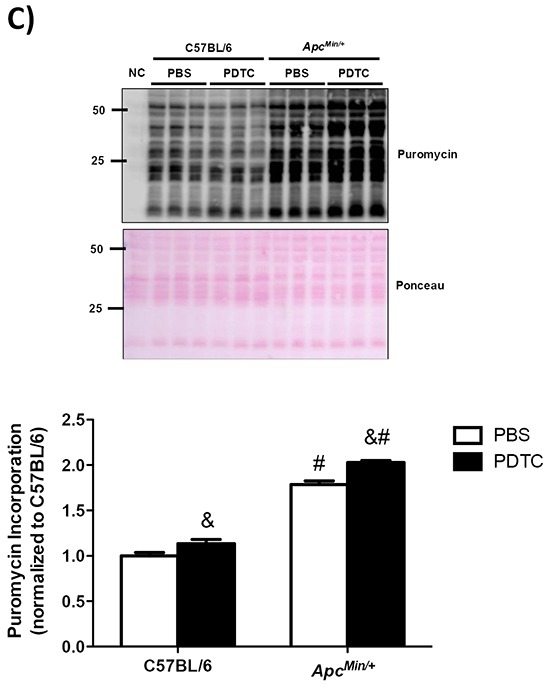
A. Upper. Representative Western blot of phosphorylated STAT3 (S727), total STAT3, phosphorylated P65 (S468), and total P65. Lower. The quantified ratio of phosphorylated to total STAT3 and P65 expression. Data are normalized to C57BL/6 + PBS mice. All samples were run on the same gel. Dotted lines demonstrate that images were cropped for representative purposes. B. Upper. Representative Western blot of phosphorylated (S2448) and total mTOR expression. Lower. The quantified ratio of phosphorylated to total mTOR expression. Data are normalized to C57BL/6 + PBS mice. All samples were run on the same gel. Dotted lines demonstrate that images were cropped for representative purposes. C. Left. Representative Western blot of liver puromycin incorporation. Lower. The quantification of liver puromycin incorporation. Data are normalized to C57BL/6 + PBS mice. All samples were run on the same gel. Values are means ± stardard error. Significance was set at P<0.05. * = signifies difference from PBS within genotype. & = signifies main effect of PDTC treatment. # = signifies main effect of ApcMin/+ genotype. Abbreviations: PBS, phosphate buffered saline. PDTC, pyrrolidine dithiocarbamate.