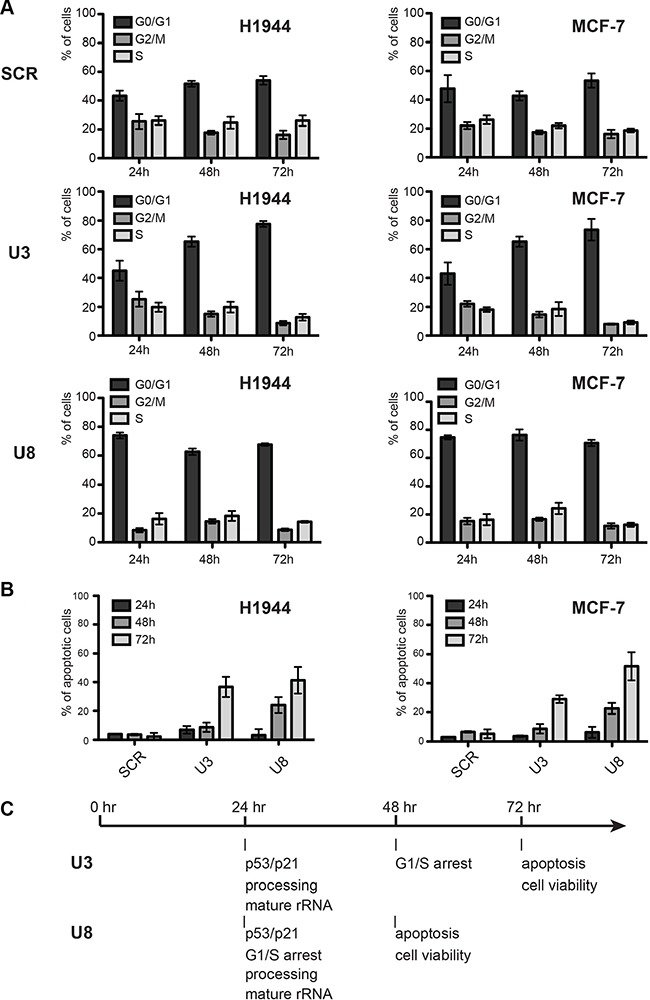
Figure 4. Effects of U3 and U8 depletion on cell-cycle progression and apoptosis.

(A) Cell-cycle analysis. The fractions of cells in the different phases of the cell-cycle (G0/G1, G2/M, or S) in populations of cells depleted of U3 or U8 for 1, 2, or 3 days were determined by staining nuclear DNA with propidium iodide and counting the fluorescence with a Muse (see Materials and Methods). As a control, cells were treated with a non-targeting silencer (SCR). (B) Apoptosis analysis. The fraction of apoptotic cells in populations of cells depleted of U3 or U8 or treated with the non-targeting control silencer (SCR) for 1, 2, or 3 days was determined by performing an Annexin V assay and counting the fluorescence with a Muse (see Materials and Methods). (C) Timeline of the appearance of phenotypes.
