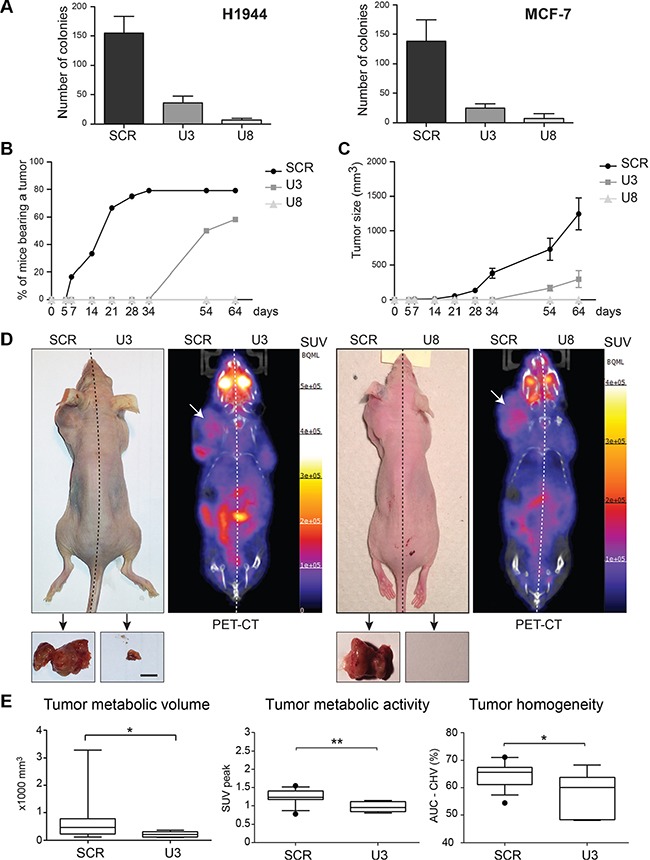
Figure 6. The box C/D snoRNAs U3 and U8 are required for in vitro and in vivo tumorigenesis.

(A) Soft-agar colony formation assay. H1944 and MCF-7 cells depleted of U3 or U8 for 3 days, and cells treated with a non-targeting control silencer (SCR), were layered on soft-agarose and incubated for 4-weeks, the colonies were stained with crystal blue and counted. Each data point represents a mean value of three independent experiments with SD. (B–E) Nude mouse xenograft experiment. Twelve nude mice were injected symmetrically in the upper body flanks with, on the right side of the animal, 5 million H1944 cells depleted of U3 or U8 for 3 days and, on the left side, 5 million H1944 cells treated with the non-targeting silencer control. (B) Percentages of mice bearing a tumor as monitored over a period of 64 days. The data show a one-month lag in tumor formation after injection of U3-suppressed cells, and no tumor formation after injection of U8-suppressed cells. (C) Tumor size estimated by caliper measurement. The data show that the tumors developed from U3-suppressed cells are substantially smaller and that no tumors developed from U8-suppressed cells. (D) One representative mouse (day 64) is shown for U3 depletion and one for U8 depletion. Large tumors are visible only in the flanks injected with control cancer cells (left side of the animals, white arrows). Left, digital photographic recording. Right, PET-CT tomograms. For simplicity, the 18F-FDG signals for the heart and bladder are not shown. The scale depicts the SUV (standard uptake values, see Materials and Methods) expressed in Bq/ml. Insets show resected tumors. Scale bar, 10 mm. (E) Tumor metabolic volume, tumor metabolic activity, and tumor heterogeneity were extracted and computed from the tomograms, according to refs [53, 75]. Tumor metabolic volume, tumor metabolic activity (through SUV peak), and tumor heterogeneity (through CSH-AUC) were compared between the U3-suppressed group and the control (scrambled depletion) group by means of an unpaired two-tailed t test, assuming equal variance between groups. The results, reported as p-values, were considered significant at p < 0.05. (*p ≤ 0.05; **p ≤ 0.01).
