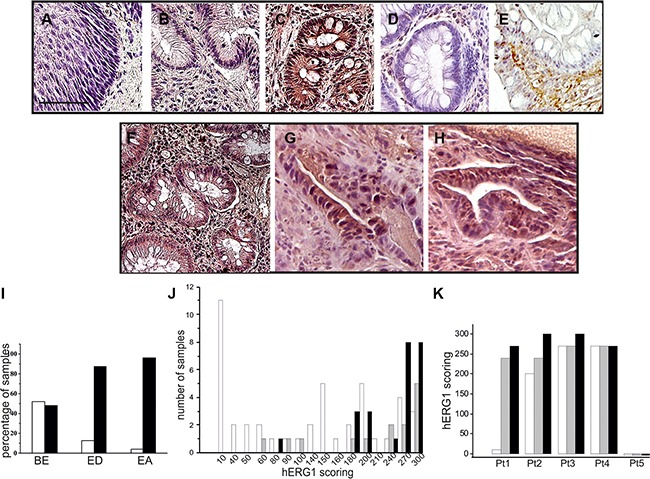
Figure 1. hERG1 expression in human esophageal carcinogenesis.

IHC was performed as described in Materials and Methods with anti-hERG1 monoclonal antibody. (A) Normal esophagus. (B) Esophagitis. (C) Representative BE sample expressing the hERG1 protein. (D) Representative BE sample negative for hERG1 expression. (E) Representative example of IHC performed with anti-hERG1B antibody (Dival Toscana Srl, Sesto Fiorentino) in a BE sample. (F–H) BE (panel F), Esophageal Dysplasia (ED, panel G) and Esophageal Adenocarcinoma (EA, panel H) of a representative patient whose lesion progressed towards malignancy. Original magnification 20×. Scale bar: 100 μm. (I) Histogram summarizing hERG1 expression in the three different groups of samples analyzed (BE, ED and EA). White bars: hERG1 negative samples, Black bars: hERG1-positive samples. (J) Histogram summarizing hERG1 scoring in the different groups (BE, ED and EA). Samples were scored as described in Materials and Methods. Analysis performed using 2-sided Student's T test revealed statistically significant differences between BE and ED (p = 0.023) and between BE and EA (p < 0.0001). (K) Histogram summarizing hERG1 scoring in the different samples (BE, ED and EA) of 5 representative patients. White bars: BE; Grey bars: ED; Black bars: EA.
