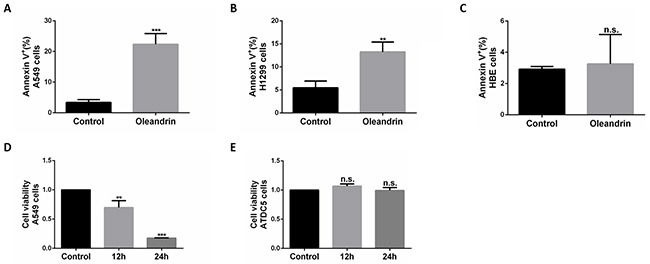
Figure 2. Oleandrin effectively induced cell death in A549 and H1299 cells, but not in HBE and ATDC5 cells.

A. Quantification of cell death in A549 cells treated with oleandrin (0.02ug/ml) for 24 hours, detected by FACS. B. Quantification of cell death in H1299 cells treated with oleandrin (0.02ug/ml) for 24 hours, detected by FACS. C. Quantification of cell death in HBE cells treated with oleandrin (0.02ug/ml) for 24 hours, detected by FACS. D, E. Quantification of cell viability in A549 cells and ATDC5 cells treated with oleandrin (0.02ug/ml) for 24 hours, detected by CCK-8 assay. All data represent mean±SEM(n=3); n.s. not siginificant; **P<0.01; ***P<0.001, compared with controls.
