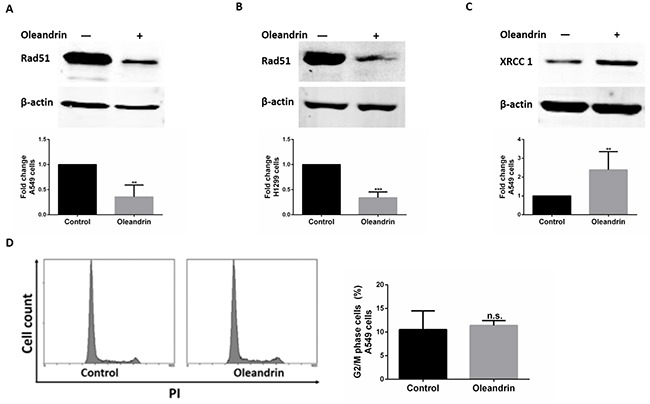
Figure 4. Expression of DNA damage repair proteins in cancer cell lines following treatment with oleandrin.

A. Western blot analysis of RAD51 and Actin in A549 cells. Quantification of RAD51 expression level was performed by densitometric analysis. B. Western blot analysis of RAD51 and Actin in H1299 cells. Quantification of RAD51 expression level was performed by densitometric analysis. C. Western blot analysis of XRCC1 in A549 cells. Quantification of XRCC1 expression level was performed by densitometric analysis. D. Cell cycle of A549 cells treated with oleandrin (0.02ug/ml) for 24 hours. Percentage of cells stalled in G2/M phase were quantified. All data represent mean±SEM (n=3). n.s. not significant; **P<0.01; ***P<0.001, compared with controls.
