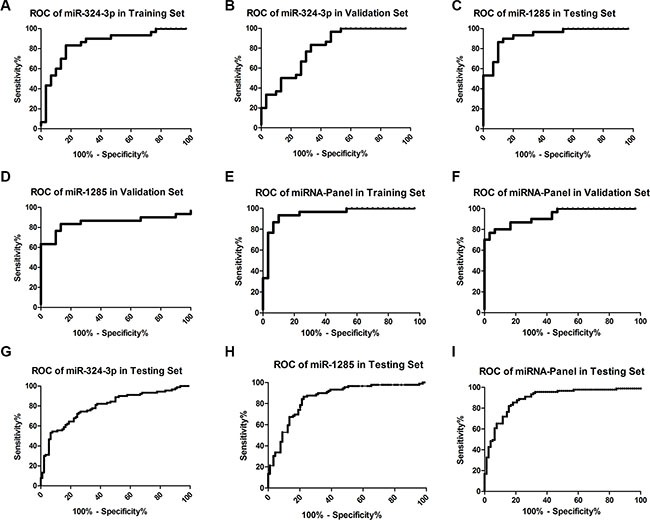
Figure 4. ROC curves of miRNAs in the different cohorts of samples.

ROC curves of miR-324-3p, miR-1285, and their combination were established for these three cohorts of samples. (A) miR-324-3p in the training Set; (B) miR-324-3p in the validation set; (C) miR-1285 in the training set; (D) miR-1285 in the validation set; (E) 2-miR-panel in the training set (F) 2-miR-panel in the validation set. (G) miR-324-3p in the testing set; (H) miR-1285 in the testing set; (I) 2-miR-panel in the testing set.
