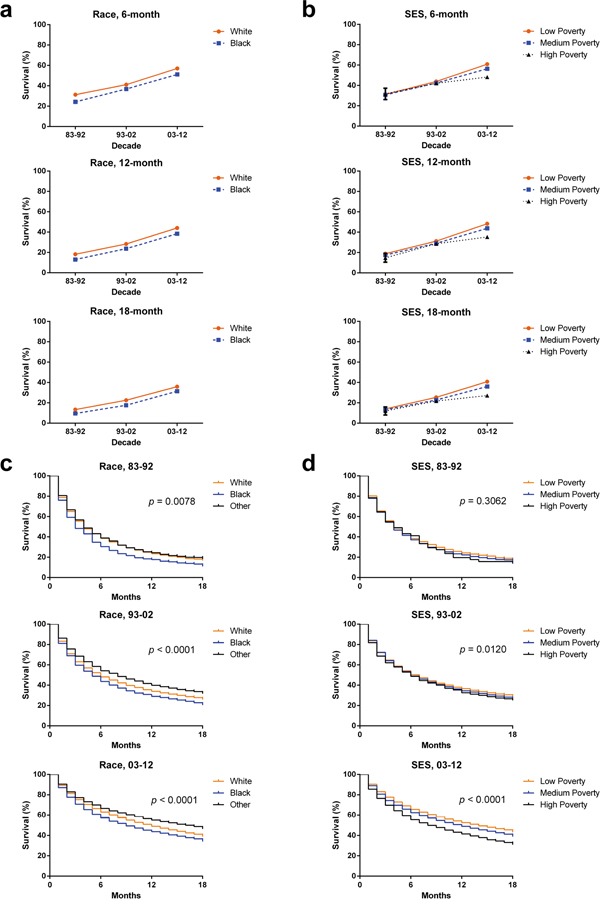
Figure 4. Six-month, 12-month, and 18-month relative survival rates according to race.

a. and SES/county-level poverty rates b. and Kaplan-Meier survival analysis according to races c. including White (orange), Black (blue) and Others (black) and SES/county-level poverty rates d. in low-poverty (orange), medium poverty (blue) and high poverty (black) for patients with HCC at eighteen SEER sites from 1983 to 2012.
