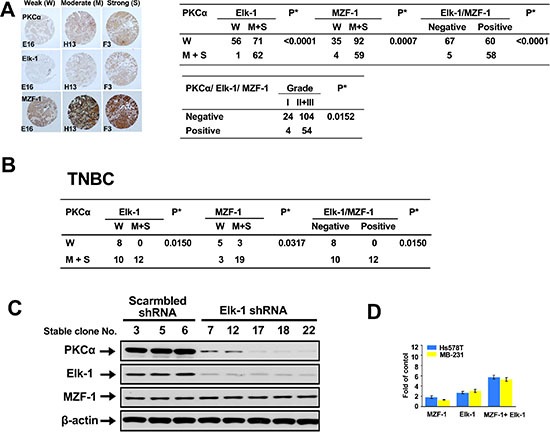
Figure 1. Correlations between PKCα expression and Elk-1/MZF-1 expression in breast cancer.

(A) Immunohistochemical analyses and correlations of PKCα and Elk-1/MZF-1 expression in human breast cancer. The left panel shows representative staining results for samples scored by visual assessment as “weak,” “moderate,” or “strong” according to staining intensity. The right panel depicts the numbers of each group classified based on PKCα, Elk-1, or MZF-1 staining intensity or grade. Moderate or strong expression of the genes of interest was given a positive rating, otherwise, a negative rating. Clinical characteristic grades of I, II, and III were obtained from US Biomax Inc. *P < 0.05, Pearson's chi-squared test. (B) Correlations of PKCα and Elk-1/MZF-1 expression by immunohistochemical analyses in human TNBC. (C) Effects of Elk-1 knockdown on PKCα expression in TNBC cell lines. Immunoblotting analysis of the expression levels of PKCα, Elk-1, and MZF-1 in cells transfected with Elk-1 shRNA. β-actin was used as an internal control. The shRNA Elk-1-expressing plasmid vector was constructed using the pcDNA-HU6 vector (given by Dr. J. Tsai Chang, Institute of Toxicology, College of Medicine, Chung Shan Medical University, Taichung, Taiwan) as the vector backbone. The shRNA Elk-1 duplex sequence obtained from the human Elk-1 genes (GenBank, NCBI) was designed using the BLOCK-iT™ RNAi Designer software available at http://www.invitrogen.com. The sequence corresponded to the coding regions relative to the first nucleotide of the start codon. Stable clones were selected with geneticin (G418; 600 μg/ml) at 37 °C for 4 weeks. (D) Luciferase activity of TNBC cell lines co-transfected with 2.5 μg of MZF-1 or Elk-1 or MZF-1/Elk-1 expression vectors. Transcriptional activity is expressed as the fold change in induction compared with the control group (n = 3).
