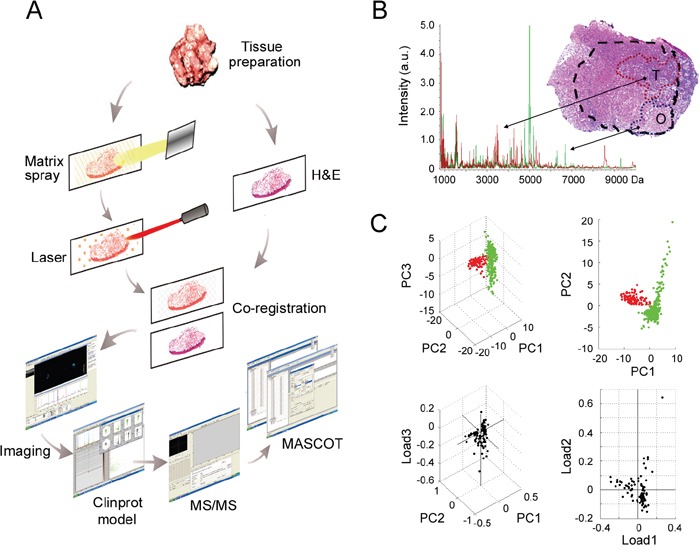
Figure 1. MALDI-IMS analyses of OSCC and adjacent non-cancerous OSF areas.

A. Schematic illustrating of the workflow of MALDI-IMS analyses of clinical tissues. B. An overlapped MALDI spectral profiles obtained from OSCC areas (red peaks) and OSF areas (green peaks), and representative H&E staining imaging for OSCC areas (T) and the adjacent OSF areas (O). T, tumor; O, OSF; a.u., arbitrary unit. C. PCA analyses were performed to evaluate the multidimensional distributions of the identified peaks. Peaks detected from OSCC or OSF areas were labeled as red or green dots, respectively
