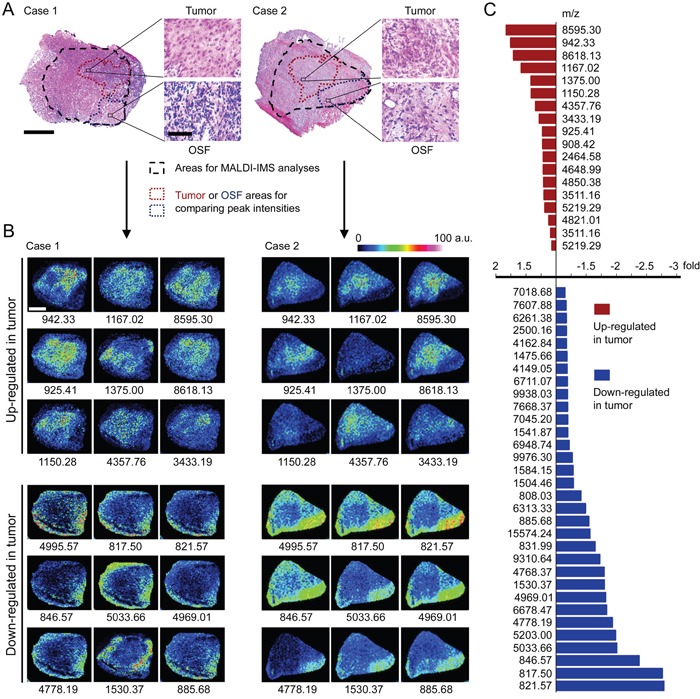
Figure 2. Altered peptide peaks identified by MALDI-IMS.

A. Representative H&E staining imaging for OSCC areas and the adjacent OSF areas. The areas selected for MALDI-IMS analyses was indicated by black dotted line. The OSCC and OSF areas used for calculating altered peaks were indicated by dark red or blue dotted line, respectively. Scale bar: original images, 250 μm; enlarged images, 50 μm. B. Representative MALDI-MS images of 18 peaks with most significant alterations. Sample Case 1 and Case 2 are the same samples as shown in (A), respectively. The m/z value of each peak was labeled under the corresponding image. a.u., arbitrary unit. C. Changed intensities of 50 identified peaks.
