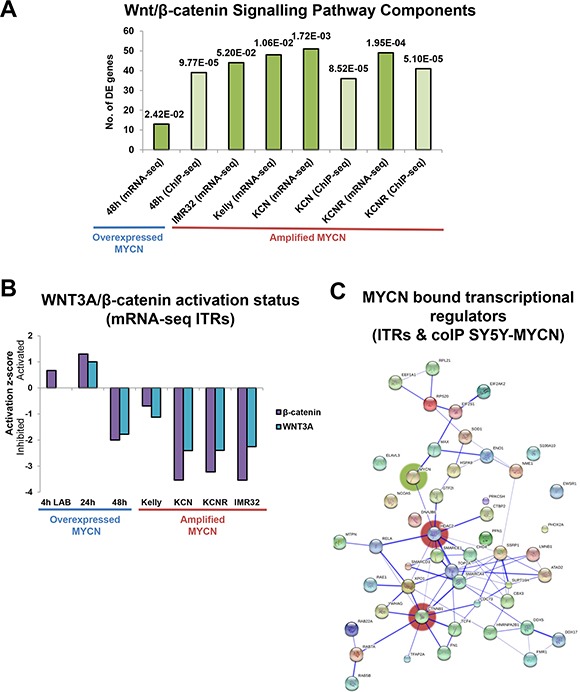
Figure 3. Omic scale investigation of MYCN interactions with the Wnt/β-catenin signalling pathway.

(A) Number of Wnt/β-catenin signalling component genes differentially expressed (mRNA-seq) or bound by MYCN protein (ChIP-seq), as identified by IPA. The pathway prediction p-value (overlap of known pathway genes and DE pathway genes) is indicated above each bar. Values are relative to those of the respective controls (MYCN overexpression time-points were compared with un-induced SY5Y-MYCN cells, while MNA lines were compared with single copy MYCN SY5Y cells). (B) Activation/inhibition z-score plot of WNT3A and β-catenin ITRs from mRNA-seq data. The 4 h LAB time-point is from 4sU-seq, whereas all other samples were generated using standard RNA-seq. (C) Protein interaction map (generated by String) of MYCN (coIP) bound proteins which were also ITRs (mRNA-seq), from SY5Y-MYCN cells. Proteins which were bound to MYCN at 4 h, 24 h or 48 h and were also an ITR at 4 h (labelled), 24 h or 48 h are included in the map. The most highly connected nodes are highlighted by red shading and MYCN by green.
