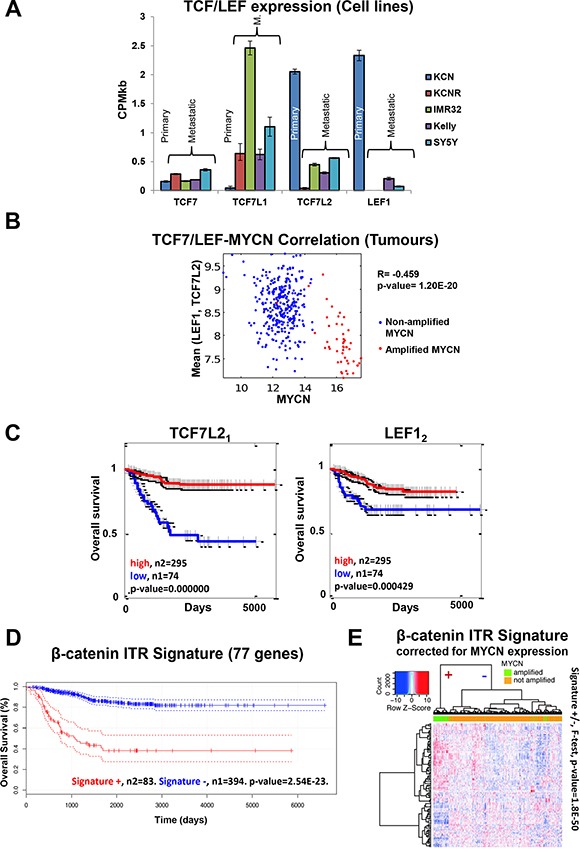
Figure 5. Cell line omics data is predictive of neuroblastoma patient expression profiles and outcome.

(A) TCF/LEF mRNA expression across the cell lines (mRNA-seq). (B) Negative correlation between MYCN mRNA and mean LEF1, TC7L2 mRNA levels in tumour samples. R denotes the Pearson product moment correlation coefficient. (C) TCF7L2 and LEF1 mRNA expression is predictive of neuroblastoma patient outcome. Subscript after gene name denotes the specific microarray probe. (D) The DE genes contributing to the identification of β-catenin as an ITR of the mRNA-seq data were used to generate a gene signature. The β-catenin activity signature was predictive of neuroblastoma patient outcome. (E) Heat map of the β-catenin ITR signature for the MYCN expression corrected mRNA levels from the patient microarray data. The dendrogram on the top shows the separation of Signature (+) and Signature (−) for all tumours, a clear separation between MYCN amplified and not amplified tumours can be seen (F-test, p-value = 1.8e-50). All 117 probe sets for the 77 genes are significantly differentially expressed (p-adj < 0.05) between MYCN amplified and MYCN non-amplified tumours.
