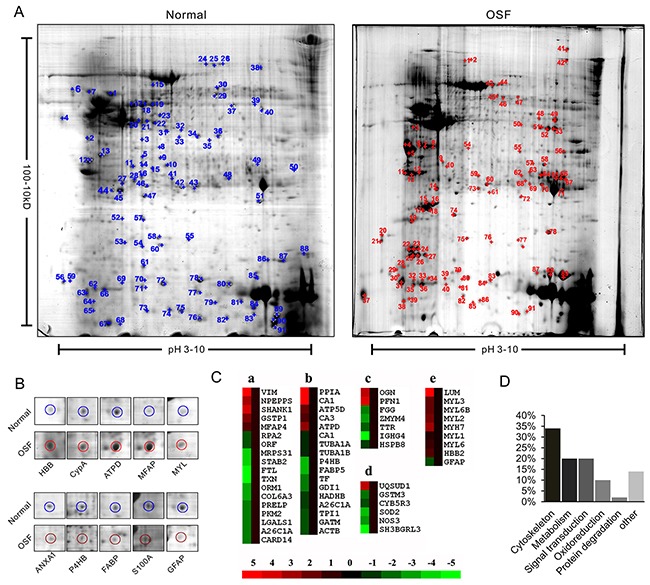
Figure 1. Proteomic identification of differently expressed proteins between normal and OSF tissue.

A. Representative 2-DE gel images of human normal and OSF tissues. The protein extracts were separated on the pH 3-10 nonlinear IPG strips and followed with 12% SDS-PAGE in the second dimension, then visualized by CBB staining. 2-D gel images were analyzed by PDQuest software and the protein spots were labeled with numbers. B. Representative spots with changed density. C. Protein cluster analysis was performed by using Cluster software. Expression of proteins in the normal tissues was constantly set as 0. Meanwhile proteins up-regulated and down-regulated in the OSF tissue are in red and green, respectively. The intensity of the color red or green is correspondent to the level of differentiation according to the color strip. D. 88 identified proteins were classified into six groups according to their function.
