
Figure 1. CD8+ and FoxP3+ cell densities in rectal adenocarcinoma.
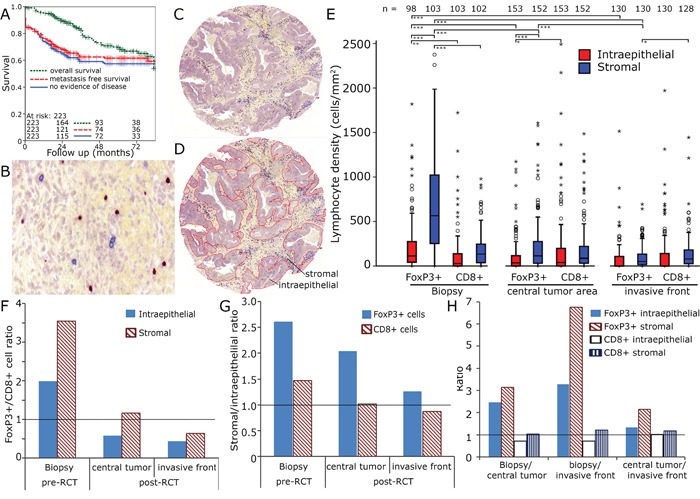
Kaplan Meier plots for overall survival, metastasis free survival and no evidence of disease in the complete cohort A. Enlarged section (1:200) of tumour stroma with immunohistochemical double staining for FoxP3 (red nucleic staining) and CD8 (blue predominantly membranous staining) B. Tissue samples were processed into tissue microarrays using a core diameter of 2 mm C. Epithelial and stromal compartments were separately analysed D. Lymphocyte densities (cells/mm2) in the biopsy, the tumour centre and the invasive front E. FoxP3+/CD8+ ratio in stromal and epithelial compartment F. Stromal/epithelial ratio of FoxP3+ and CD8+ cells G. Ratio of pre-RCT biopsies, central tumour and invasive front of epithelial and stromal FoxP3+ and CD8+ cells H.