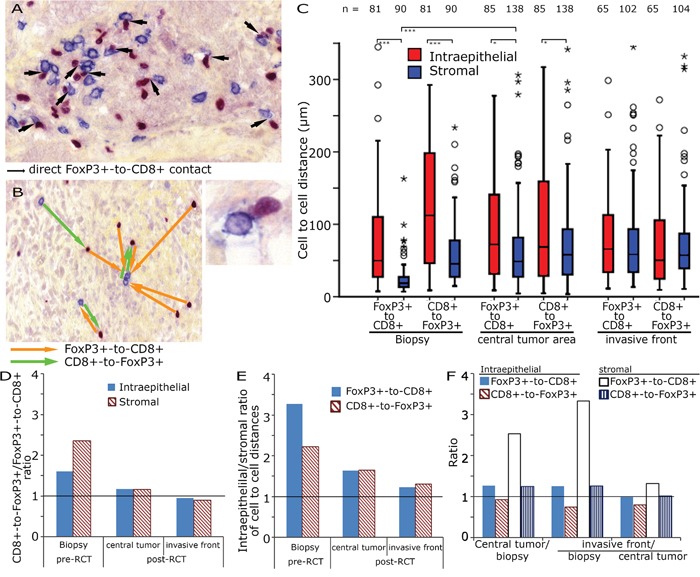
Figure 3. CD8+ to FoxP3+ cell distances in rectal adenocarcinoma.

Double staining for FoxP3+ and CD8+ in tumour stroma with highlighted direct cell-to-cell interactions (arrows, 200x original magnification) and a direct FoxP3+ to CD8+ interactions at higher magnification, bottom right A. Example for the calculation of the shortest distance between FoxP3+ and CD8+ cells (orange arrows) and CD8+ to FoxP3+ (green arrows) B. Cell-to-cell distances (μm) in the biopsy, the central tumour area and the invasive front C. CD8+-FoxP3+/FoxP3+-CD8+ ratio in preRCT biopsies and post RCT central tumour and invasive front D. Epithelial/stromal ratio of FoxP3+-CD8+ and CD8+-FoxP3+ distances E. Ratio of preRCT biopsies, central tumour and invasive front of epithelial and stromal FoxP3+-CD8+ and CD8+-FoxP3+ distances F.
