
Figure 5. Observed compared to expected cell-to-cell distances.
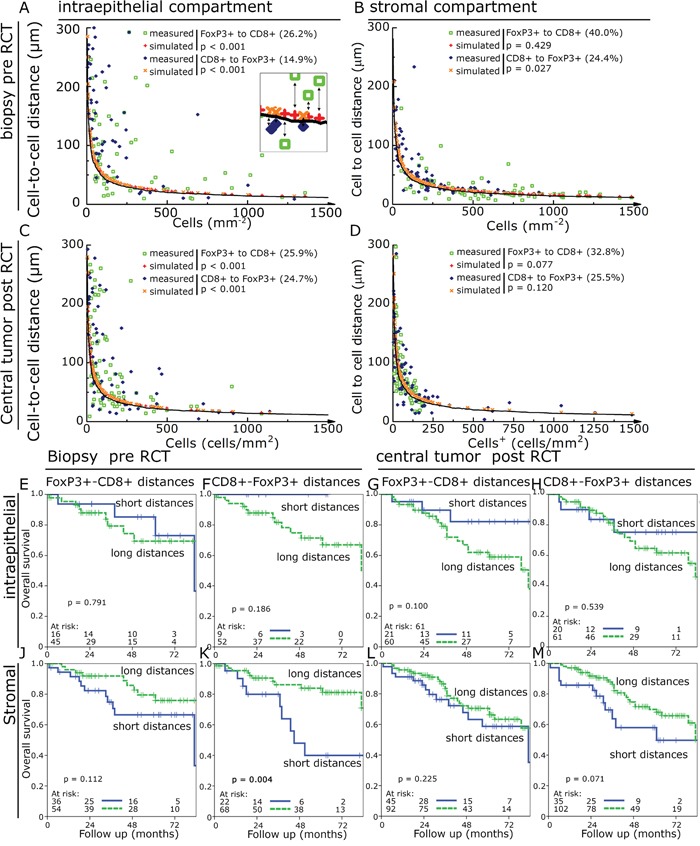
Observed cell-to-cell distances in dependence of cell densities (green open squares and blue diamonds) were compared to simulated values (red plus and orange crosses). The solid line indicates 10% shorter distance than the simulated values and was used as cut off for defining observed distances shorter than the expected values. Cell-to-cell distances compared to cell densities in pre-RCT biopsies in the epithelial compartment A. and in the stromal compartment B. as well as in post-RCT central tumour in the epithelial C. and stromal compartment D. Kaplan-Meier plots using the above identified samples with shorter distances than expected compared to longer distances for OS. FoxP3+-CD8+ cell distances in the epithelial pre- RCT biopsies E.; CD8+-FoxP3+ cell distances in the epithelial pre-RCT biopsies F.; FoxP3+-CD8+ cell distances in the epithelial post-RCT central tumour G.; CD8+-FoxP3+ cell distances in the epithelial post-RCT central tumour H. and FoxP3+-CD8+ cell distances in the stromal pre-RCT biopsies J.; CD8+-FoxP3+ cell distances in the stromal pre-RCT biopsies K.; FoxP3+-CD8+ cell distances in the stromal post-RCT central tumour L.; CD8+-FoxP3+ cell distances in the stromal post-RCT central tumour M.