
Figure 4. siRNA-induced Bod1 knockdown or miR-142-3p overexpression increases premature chromatid separation in 786-O cells.
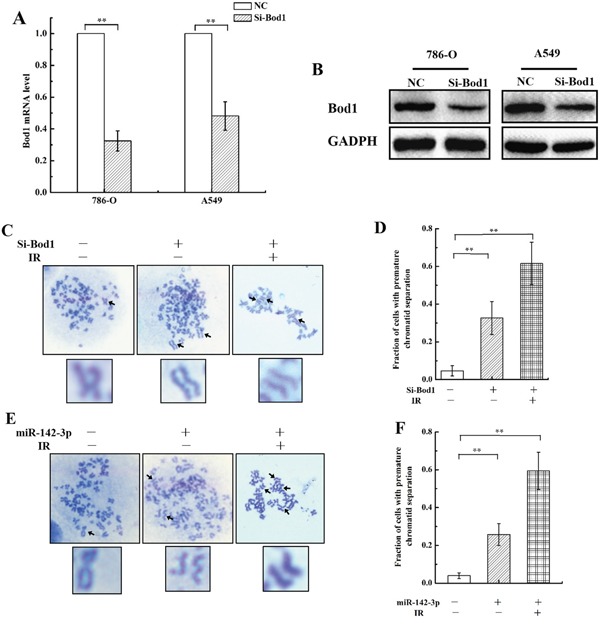
A. Relative Bod1 mRNA expression was measured by qRT-PCR in 786-O and A549 cells after transfection with Bod1-siRNA or negative control (NC). GAPDH was used as the internal control. B. Bod1 protein level were measured by western blot in 786-O and A549 cells after transfection with Bod1-siRNA or negative control (NC). C & D. Proportions of 786-O cells with premature chromatid separation in negative control, Bod1 inhibition, and Bod1 inhibition plus irradiation groups based on chromosome configuration analysis. E & F. Proportions of 786-O cells with premature chromatid separation in negative control, miR-142-3p overexpression, and miR-142-3p overexpression plus irradiation groups based on chromosome configuration analysis. Arrows in the blown-up images indicate a normal chromosome in a negative control cell and chromatids in cells from the two treatment groups. Each data point represents the mean of three separate experiment; bars indicate standard errors. **P < 0.01.