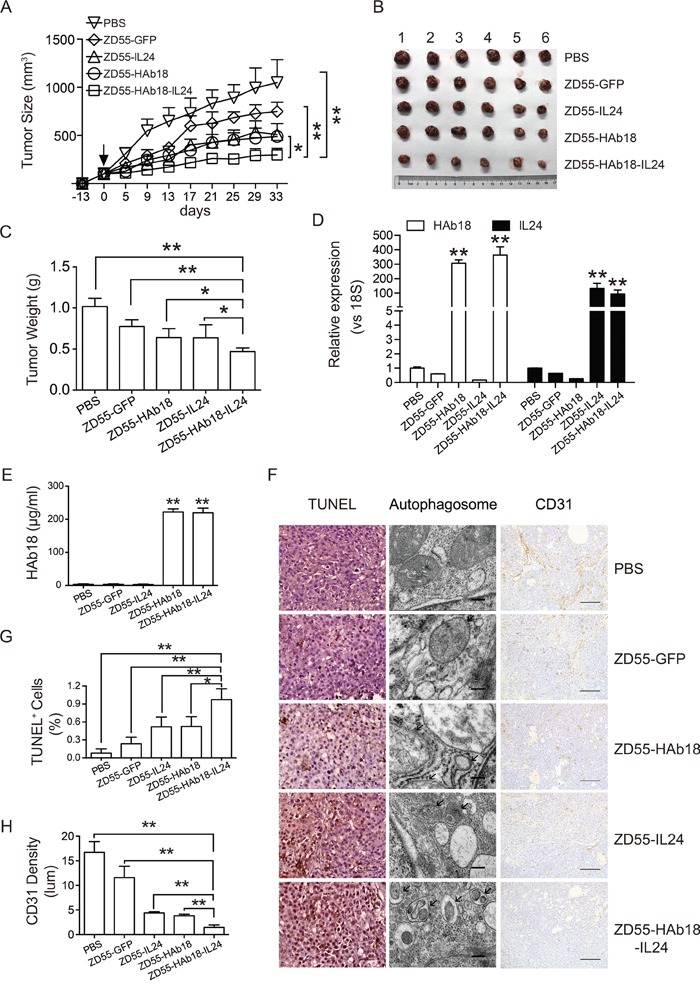
Figure 5. ZD55-HAb18-IL24 displays antitumor activity in vivo.

A. Growth curve of PLC/PRF/5 xenograft tumors after intratumoral injection of the indicated adenoviruses. Oncolytic adenoviruses were injected 13 days after subcutaneous inoculation of PLC/PRF/5 cells (day 0, arrow). The corresponding volumes of PBS were injected as a control. B, C. Tumors were excised, weighed, and photographed 33 days after injection. Significant decreases in tumor volume (B) and weight (C) were observed in the ZD55-HAb18-IL24-treated group. The bars represent the mean ± S.D. (n = 6). D. qRT-PCR detection of HAb18 and IL24 expression in tumors from each group. Data were normalized to 18S, and are shown as the fold change relative to PBS-treated cells. E. ELISA detection of HAb18 concentration in serum 33 days after virus injection. F. Representative images of TUNEL staining (scale bar, 100 μm; left panel), electron microscopy (scale bar, 200 nm; middle panel), and CD31 immunohistochemical staining (scale bar, 100 μm; right panel) of tumor sections from each group. G. Quantification of the TUNEL staining results in (F). H. Quantification of CD31-positive cells in (F). The bars represent the mean ± S.D. of triplicate samples. *p < 0.05, **p < 0.01.
