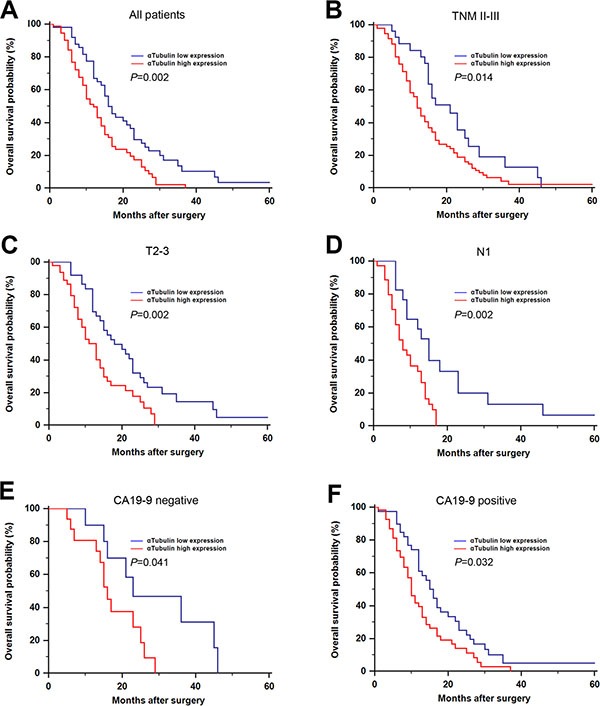
Figure 2. Kaplan–Meier analysis for OS of patients with gastric cancer according to the αSMA expression.

Kaplan–Meier analysis for OS of patients with gastric cancer according to αSMA expression in all patients (A), TNM II-III (B), T2-3 (C), N1 (D), CA19-9 negative (E), CA19-9 positive (F).
