
Figure 6.
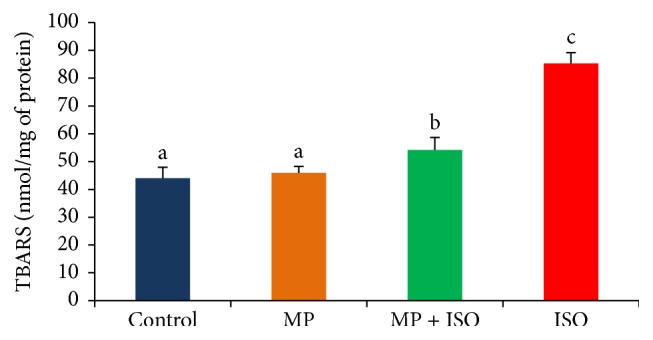
Effects of MP and ISO on cardiac LPO levels in normal and different treated rats. The bars represent means ± SD (n = 8); bars with different letters (a, b, c) indicate significantly different mean values at p < 0.05.
Official websites use .gov
A
.gov website belongs to an official
government organization in the United States.
Secure .gov websites use HTTPS
A lock (
) or https:// means you've safely
connected to the .gov website. Share sensitive
information only on official, secure websites.
Effects of MP and ISO on cardiac LPO levels in normal and different treated rats. The bars represent means ± SD (n = 8); bars with different letters (a, b, c) indicate significantly different mean values at p < 0.05.