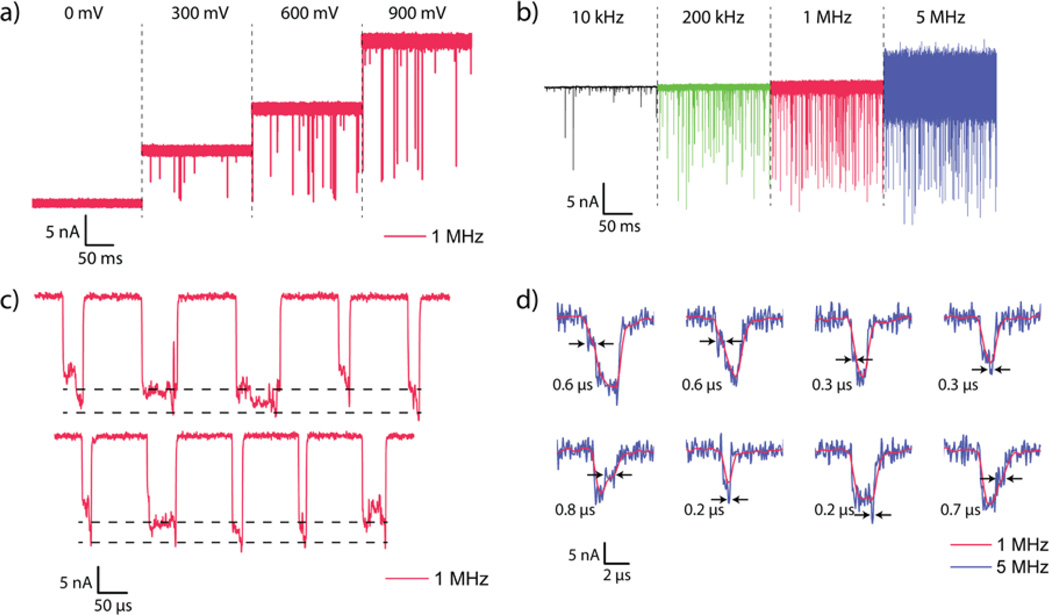
Figure 3.
Nanopore signal variation with applied bias and frequency cutoffs. (a) Concatenated time trace of 100-nt ssDNA translocation recordings through Pore 3 at biases of 0 mV, 300 mV, 600 mV and 900 mV. Each trace is 0.2 s long and filtered using a 4-pole Bessel filter with a cutoff frequency of 1 MHz. (b) Concatenated time trace of a 0.2 s long recording of 100-nt ssDNA translocation through Pore 1 at 900 mV bias. The traces are filtered using a 4-pole Bessel filter to 10 kHz, 200 kHz, 1 MHz and 5 MHz bandwidths. Low cutoff frequencies show severe degradation of signal amplitudes. All data recorded at 40 MSPS and then resampled to 4× the cutoff frequency. (c) Concatenated events from 100-nt ssDNA translocation through Pore 3 at 900 mV bias padded with baseline points for reference. The dashed black lines indicate the shallow level corresponding to the molecule being in the access region and the deep level corresponding to the actual translocation. The standard deviation of the current in the shallow region is significantly higher than even that of the baseline. (d) Example events from 100-nt ssDNA translocation through Pore 1 at 900 mV bias showing features visible at 5 MHz bandwidth (blue) that are invisible at 1 MHz bandwidth (red). Feature durations are indicated.

