
Fig. 1.
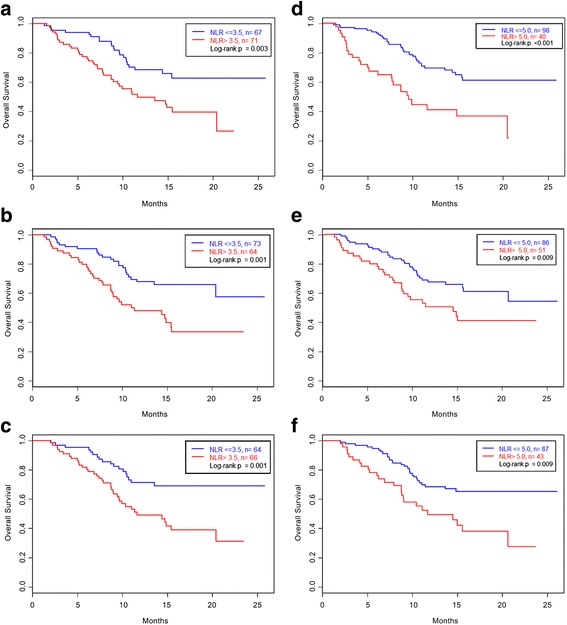
Kaplan Meier Survival Plots by NLR. Kaplan Meier survival plots were generated using an NLR cutoff of 3.5 at baseline (a), at 6 weeks (b), and at 12 weeks (c) and an NLR cutoff of 5 at baseline (d), at 6 weeks (e), and at 12 weeks (f). A significant difference in overall survival was seen in all three categories, illustrating that an NLR > 3.5 and an NLR > 5 serve as poor prognostic factors associated with worse overall survival at diagnosis and during chemotherapy