
Fig. 3.
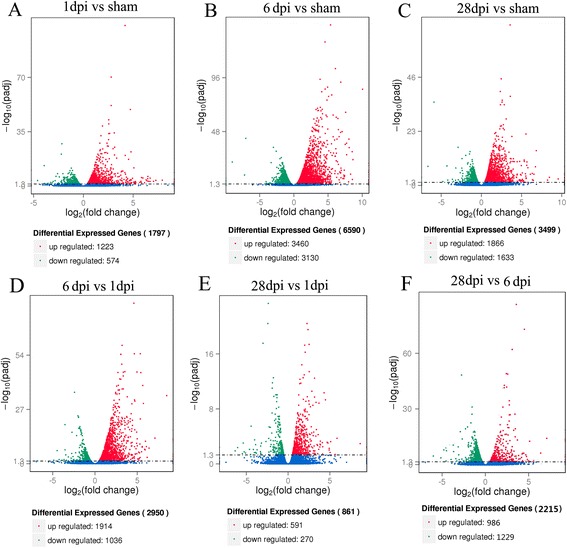
Volcano map of differentially expressed genes. Significantly upregulated and downregulated genes are shown as a red and green dot, respectively. The blue dot represents no significant difference between the expressions of genes. a 1 dpi vs sham, b 6 dpi vs sham, c 28 dpi vs sham, d 6 dpi vs 1 dpi, e 28 dpi vs 1 dpi, f 28 dpi vs 6 dpi