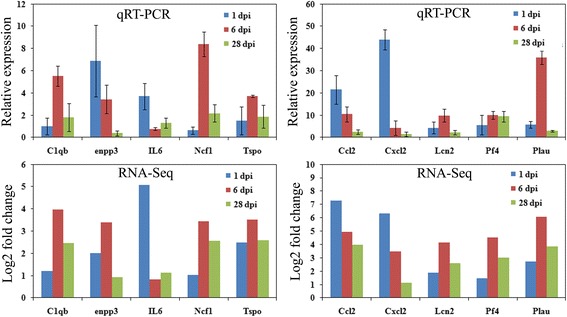
Fig. 4.

Quantitative RT-PCR validations of DEGs characterized by RNA-Seq. The relative expression level of target mRNAs was calculated using the ΔΔCt method and expressed relative to the value in the sham group (designated as 1). Data represent the mean ± SD (n = 3). Log2 fold change was the ratio of average Log2 folds between samples
