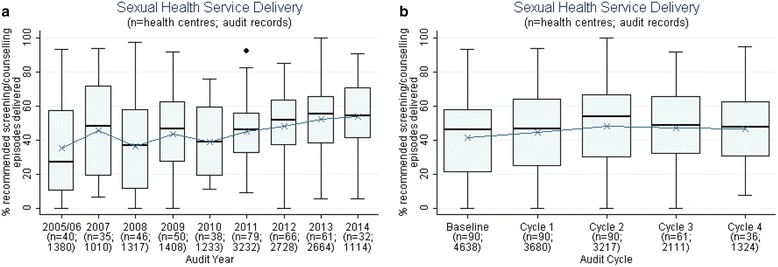
Fig. 1.

Sexual health related service delivery over time: Mean percentage of STI testing and counsellinga delivered per health centre over audit year (a) and cycle (b) (n = number of health centres; number of client records).
aComposite indicator includes NAAT for gonorrhoea and chlamydia, syphilis screen and reproductive health discussion
