
Fig. 1.
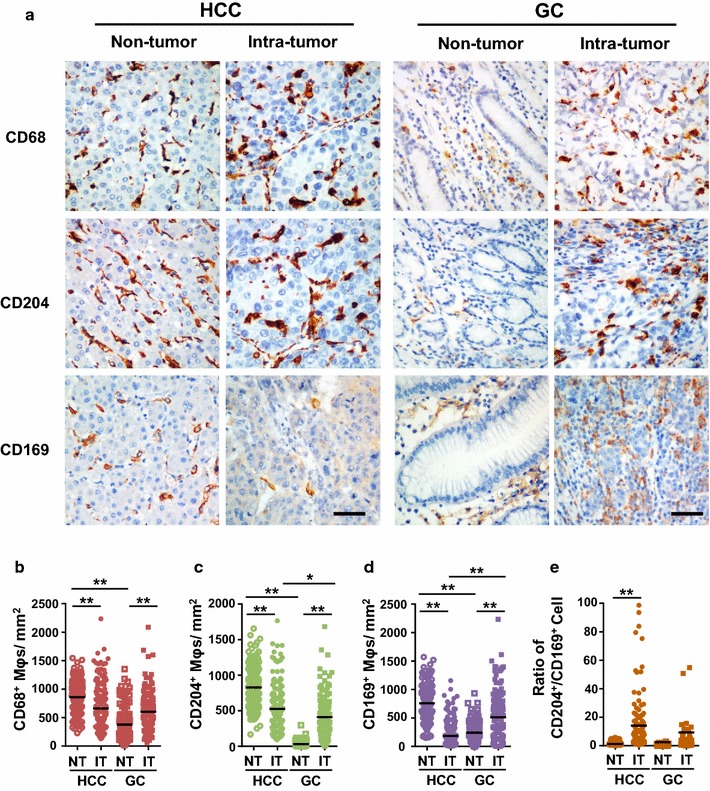
Mφs distributions in the non-tumor (NT) and intra-tumor (IT) regions of hepatocellular carcinoma (HCC) and gastric cancer (GC). a Representative immunohistochemistry images of CD68+ Mφs, CD204+ Mφs, and CD169+ Mφs in human HCC and GC tissues. Scale bar, 100 μm. b–d The numbers of CD68+ Mφs (b), CD204+ Mφs (c), CD169+ Mφs (d) and CD204+/CD169+ Mφs ratios (e) in the NT and IT regions of human HCC and GC tissues. Cell numbers were calculated as the cell count per ×400 field. Data are expressed as mean ± SEM. *P < 0.05; **P < 0.01