
Fig. 2.
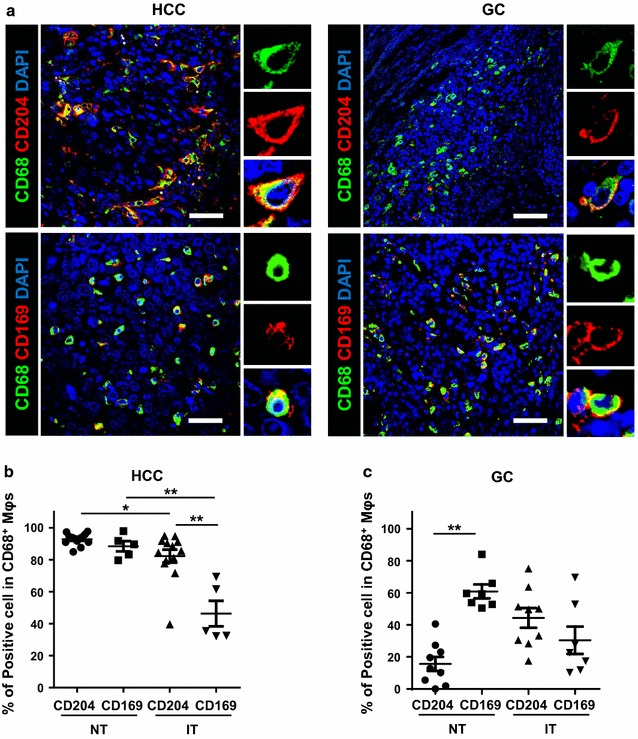
Composition patterns of Mφs subpopulations in CD68+ Mφs of HCC and GC intra-tumor tissues. a Paraffin-embedded tissue sections (n = 5) were subjected to three-color immunofluorescence for CD204 (red) or CD169 (red) with CD68 (green) and DAPI counterstaining (blue) in the intra-tumor regions of HCC and GC. b–c Percentage of CD204+ Mφs and CD169+ Mφs subpopulations in CD68+ Mφs of HCC (b) and GC (c). Data are expressed as mean ± SEM. *P < 0.05; **P < 0.01