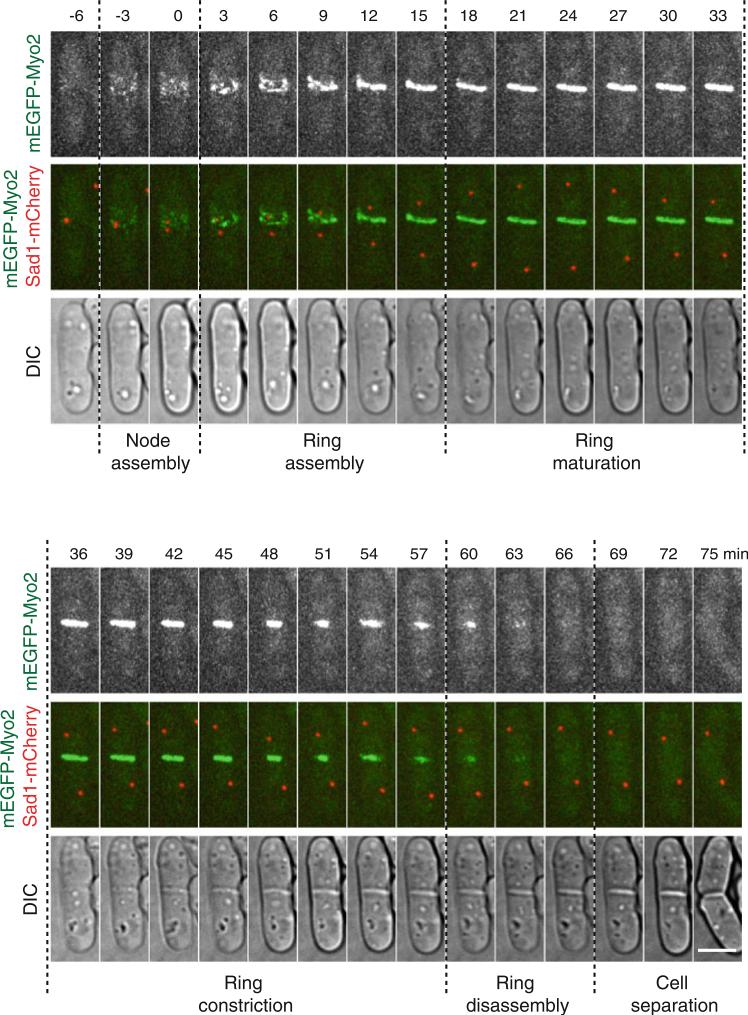
Fig. 4.
Stages of cytokinesis in fi ssion yeast. Wild-type cells expressing mEGFP-Myo2 and Sad1-mCherry at their endogenous levels were used. The time course of a representative cell from a movie with 90 s interval is shown. The fluorescence images are a maximum intensity projection of 13 slices with 0.5 μm spacing. Time zero marks SPB separation. The dotted lines separate the various stages of cytokinesis. Bar, 5 μm

