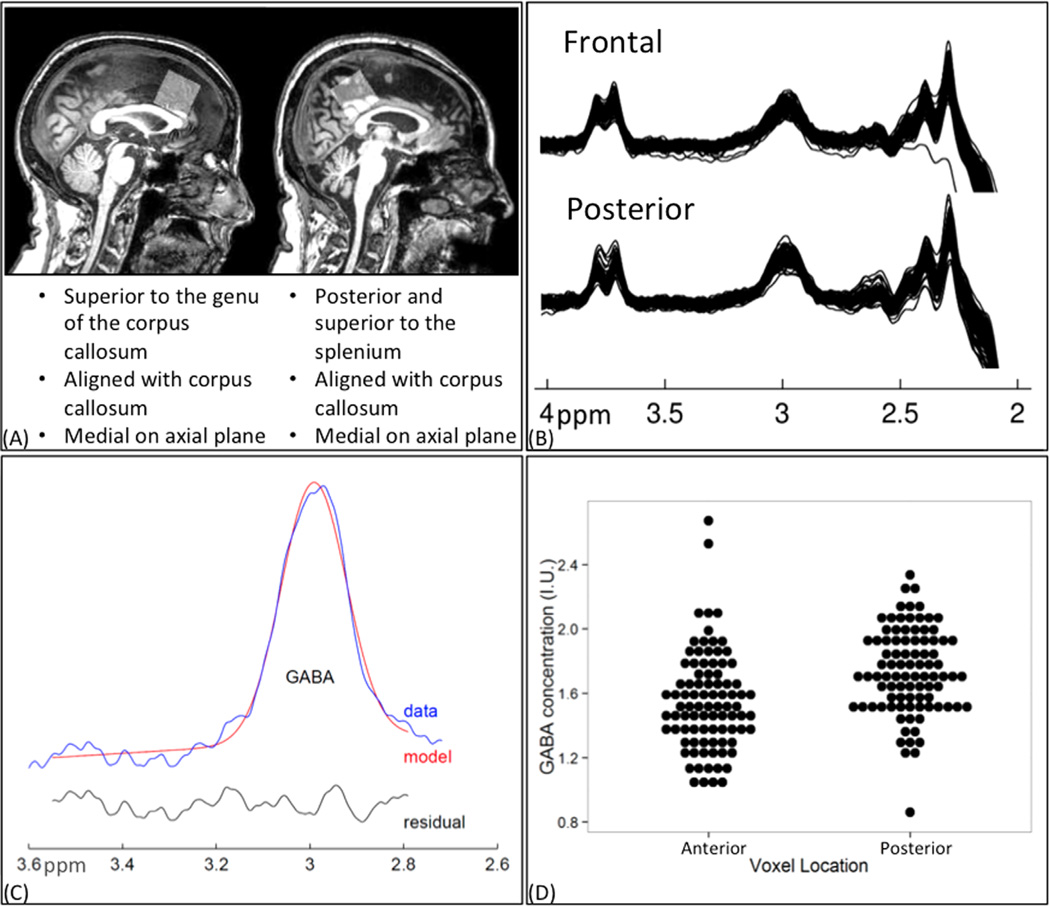
Figure 1.
(A) Voxel locations in the frontal and posterior regions of the brain. The gray box represents the location of the 3 × 3 × 3 cm voxel collected using Mescher-Garwood point-resolved spectroscopy. (B) Edited spectra from the frontal and posterior voxels for all subjects. Gamma-aminobutyric acid (GABA) peak is at 3.02 ppm. (C) Representative Gannet GABA model fit. (D) Stacked dot plot demonstrating greater GABA concentrations in the posterior voxel. I.U., institutional unit.

