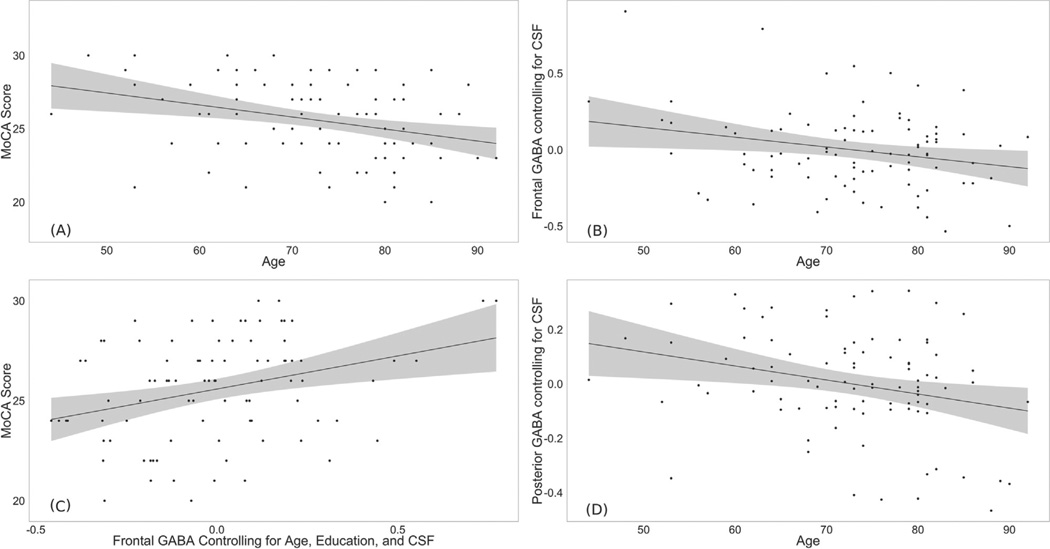
Figure 2.
Confidence intervals are 95% for the regression line. (A) Plot demonstrating greater participant age associated with lower performance on the Montreal Cognitive Assessment (MoCA). (B) Plot demonstrating the age-related decrease in frontal gamma-aminobutyric acid (GABA) concentrations. (C) Plot demonstrating the age-related decrease in posterior GABA concentrations. (D) Plot demonstrating the relation between frontal GABA concentrations and MoCA scores. The relation remains significant when the two highest GABA data points are removed. CSF, cerebrospinal fluid.

