Fig. 3.
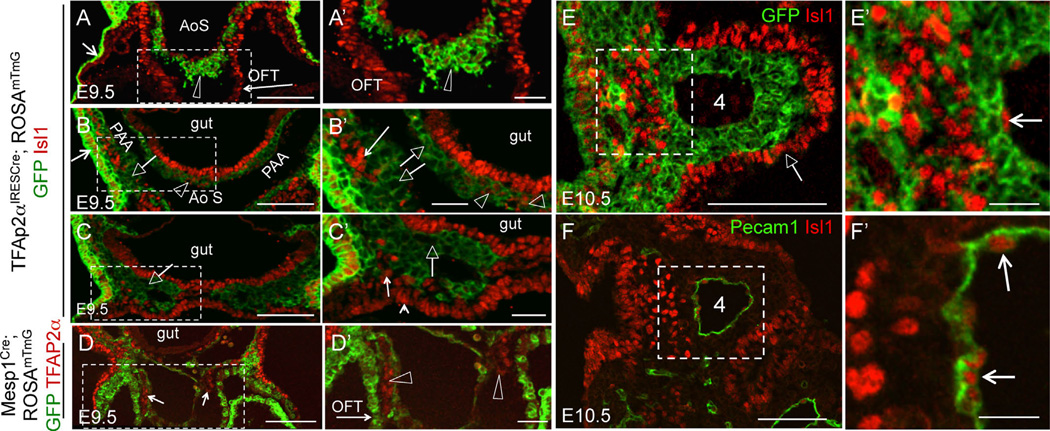
Neural crest-derived cells in the cardiac outflow tract express Isl1. (A–C), (A′–C′) Transverse sections through TFAP2αIRESCre; ROSAmTmG embryos isolated at E9.5. Boxed regions in (A–D) are expanded in (A′–D′). (A–C) Fate map of TFAP2αIRESCre - expressing cells and their descendants. GFP (green) marks both the surface ectoderm (short arrows in A–B) and neural crest-derived cells, marked by the open arrowheads and open arrows. Arrowheads point to Isl1+ neural crest-derived cells and arrows point to Isl1-negative neural crest cells. Isl1 staining is in red. (A–A′). Section is at the level of the outflow tract (OFT, long arrow). AoS-aortic sac. (B–B′) Section is at the level of the 3rd pharyngeal arch. (C–C′) Section is at the level of the 4th pharyngeal arch. Open arrows point to IslGFP+ pharyngeal neural crest cells, arrows in (B′–C′) point to Isl+GFP− pharyngeal mesoderm, and a small arrowhead in (C′) points to Isl+GFP splanchnic mesoderm. (D–D′) E9.5 embryos. Transverse section at the OFT level shows lineage map of Mesp1-derived cells (GFP+, green) and TFAP2α expression (red, small arrows in D). OFT myocardium originates from Mesp1-derived cells (long arrow in D′). TFAP2α+GFP− cells (open arrowheads) in the OFT are not derived from the mesoderm. (E–E′), (F–F′) E10.5 embryos. Boxed areas in (E–F) are expanded in (E′–F′). (E) The majority of neural crest cells in the pharyngeal arches are Isl1GFP+. Isl1+GFP− cells form the arch core mesoderm (boxed in E, expanded in E′) and PAA endothelium (arrows in F′). Native GFP and Tomato fluorescence in all sections were extinguished by mounting sections in 50/50 MeOH/Glycerol, see Methods. Scale bars are 100 µm in (A–D), (E–F), 30 µm in (A′–D′), 20 µm in (E′–F′).

