Figure 1.
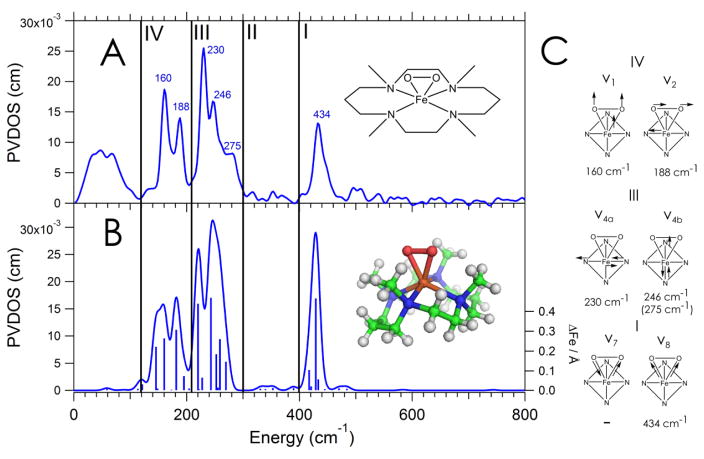
A: NRVS spectrum of 1 divided into four energy regions with a depiction of its structure as an inset. B: DFT-simulated NRVS spectrum of 1, with sticks corresponding to the amount of Fe displacement in each mode and the DFT-optimized structure as an inset. C: Schematic depictions of the vibrations in 1 divided by energy region.

