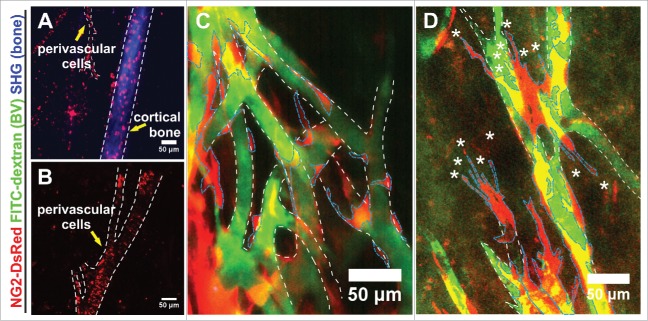
Figure 5.
Distribution of NG2+ cells in a transplanted split femur. (A, B) 10 days after transplantation, NG2-expressing cells marked by DsRed were prominent within the cortical bone (A) and lined BVs (demarked by white outline) without abundant ramifications of a split femur (A, B). (C) NG2+ perivascular cells (demarked by blue outline) lined BVs (demarked by white outline) distant from the sprouting edge in an apparently stable association; (D) NG2+ perivascular cells (blue outline) liaising with BVs (white outline) at the sprouting edge were characterized by multiple filopodia (asterisks) and an apparently loose association with the BVs. (A–D) MIPs of multiphoton image stacks, 4 transplants.

