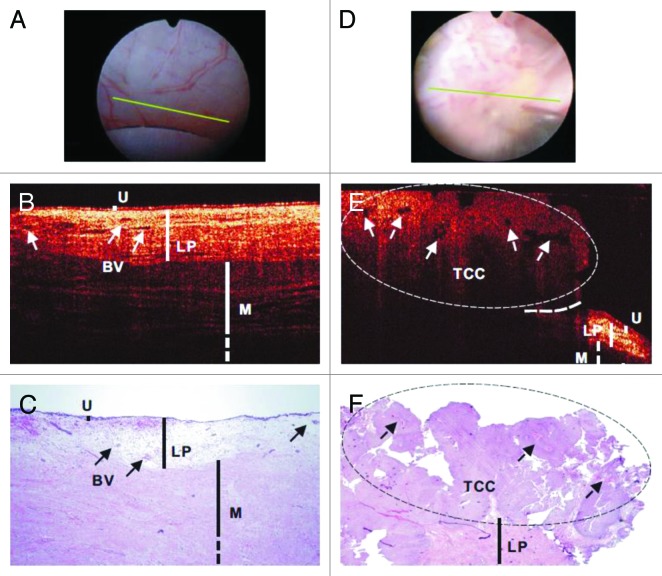
Figure 3. In vivo surface (A and D), cross-sectional OCT (B and E), and H&E-stained histologic images (C and F) of normal human bladder (A–C) vs a papillary TCC (D–F). The morphologic details of normal bladder (U, urothelium; LP, lamina propria; M, upper muscularis) were clearly delineated by OCT, but those of papillary TCC diminished. Solid arrows: subsurface blood vessels; dashed arrows: papillary features; dashed circle: TCC, identified by OCT based on increased urothelial heterogeneity; dashed line: boundary with adjacent normal bladder. Figures and captions are adapted from reference 107 with permission.

An official website of the United States government
Here's how you know
Official websites use .gov
A
.gov website belongs to an official
government organization in the United States.
Secure .gov websites use HTTPS
A lock (
) or https:// means you've safely
connected to the .gov website. Share sensitive
information only on official, secure websites.
