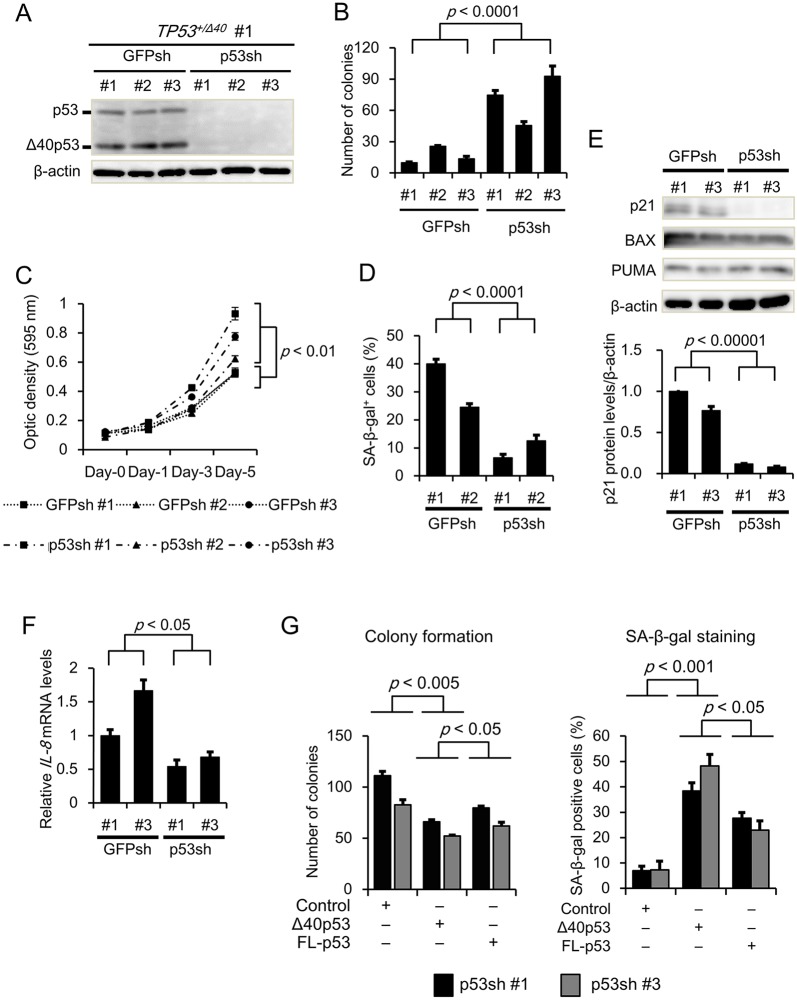
Fig. 2.
Effect of TP53 gene knockdown on cell growth and senescence in HepG2/TP53+/Δ40 cells. (A) Confirmation of TP53 gene knockdown in HepG2/TP53+/Δ40 cells. Protein levels of p53 isoforms were examined by western blotting with an anti-p53 polyclonal antibody. The HepG2/TP53+/Δ40/GFPsh clones (#1 to #3) and HepG2/TP53+/Δ40/p53sh clones (#1 to #3) are shown. β-actin was used as an internal control. (B) Effect of TP53 gene knockdown on clonogenicity. Colony formation assays were performed as described in the legend of Fig. 1C. Bar graphs represent the number of stained colonies (n=6). (C) Effect of TP53 gene knockdown on cell survival. An MTT assay was performed as described in the legend of Fig. 1D. The optical density (595 nm) at each time point (day 0, 1, 3, and 5) is expressed as the mean±s.e.m. (n=4). (D) Effect of TP53 gene knockdown on cellular senescence. A SA-β-gal assay was performed as described in the legend of Fig. 1E. Bar graphs represent the percentage of SA-β-gal-positive cells (n=3). (E) Protein expression of p21, BAX and PUMA were examined by western blotting as described in the legend of Fig. 1F. After normalization to β-actin protein levels, the data are expressed relative to the protein expression in the HepG2/TP53+/Δ40/GFPsh #1 cells, which was arbitrarily defined as 1. (F) qRT-PCR analysis for the gene expression levels of IL-8 in HepG2/GFPsh and HepG2/p53sh clones. Relative gene expression levels are shown after normalization to GAPDH mRNA expression. The data are expressed relative to the mRNA level found in the corresponding sample of HepG2/GFPsh clone #1, which was arbitrarily defined as 1. (G) Effect of Δ40p53 on clonogenicity and senescence in the HepG2/TP53+/Δ40/p53sh clones. pLXSN, Δ40p53/PLXSN and FL-p53/PLXSN retroviruses were generated using 293T cells. After the viral supernatants were prepared, the HepG2/TP53+/Δ40/p53sh clones (#1 and #3) were infected at the same MOI with pLXSN, Δ40p53/PLXSN, and FL-p53. After infection for 48 h, the cells were treated with neomycin (800 μg/ml) for 14 days, followed by staining with either Crystal Violet or for SA-β-gal. The upper and lower bar graphs represent the number of colonies and the percentage of SA-β-gal-positive cells, respectively (mean±s.e.m.; n=3).

