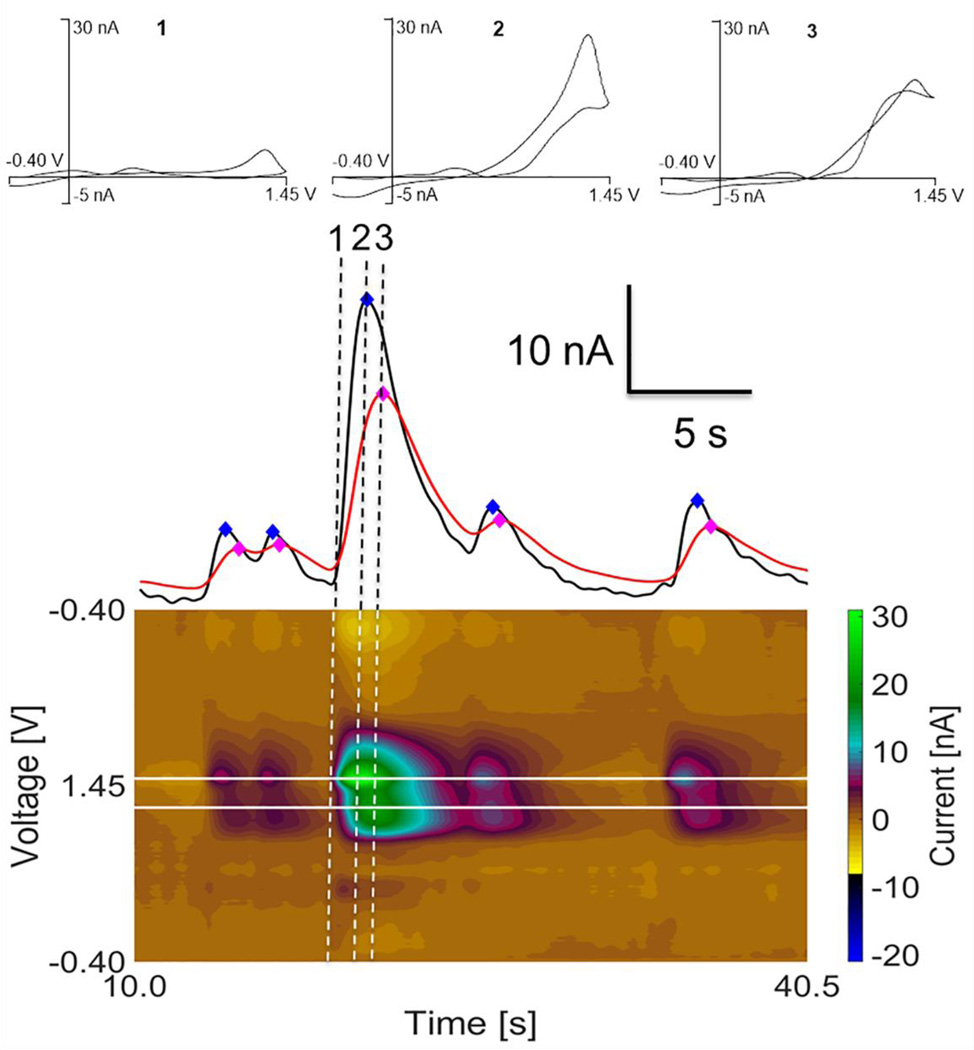
Figure 1.
In vivo spontaneous adenosine transients in the hippocampus. Top: CVs of adenosine are taken from a single adenosine transient event, showing changes of adenosine over time. CV 1 is when adenosine first appears. CV 2 is when the primary peak is at a maximum and CV 3 is when the secondary peak is at maximum. Middle: Current vs. time traces with 5 transients detected. The primary peak maximums (black trace) occur before secondary peak maximums (red trace) and is the basis for the lag time filter (diamonds mark peak max values). The Sp / Pp ratios for each of the 5 peaks are between 0.49 and 0.89. Bottom: False color plot of adenosine transients with white lines marking the primary and secondary oxidation voltages.

