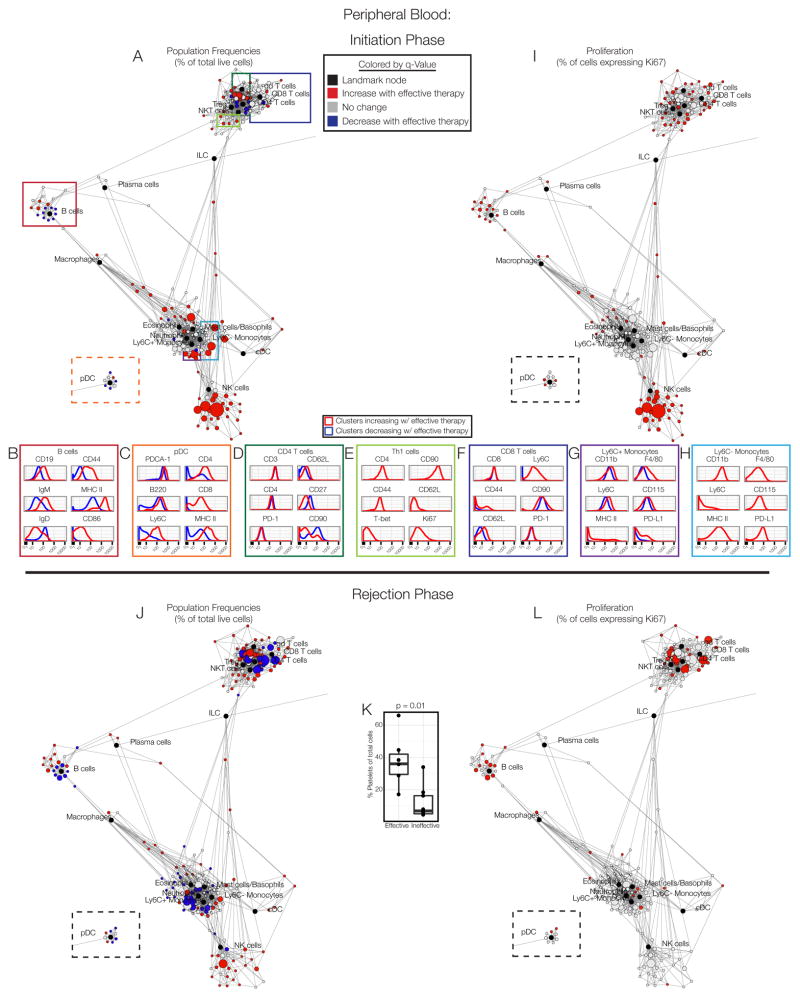
Figure 4. Immune responses are sustained in peripheral blood.
(A) Scaffold map of blood on day 3. (B) Expression profile of B cell, pDC, (D) CD4 T cell, (E) Th1 cell,. (F) CD8 T cell, (G) Ly6C+ monocyte, or (H) Ly6C- monocyte clusters expanding with effective therapy (red histogram) versus those decreasing (blue histogram). (I) Scaffold map of Ki67 expression in immune cell clusters in blood on day 3. (J) Scaffold map of blood on day 8. (K) Frequency of platelets on day 8. (L) Scaffold map of Ki67 expression in cells in blood on day 8. See also Fig. S4, S6, Tables S2–S3.

