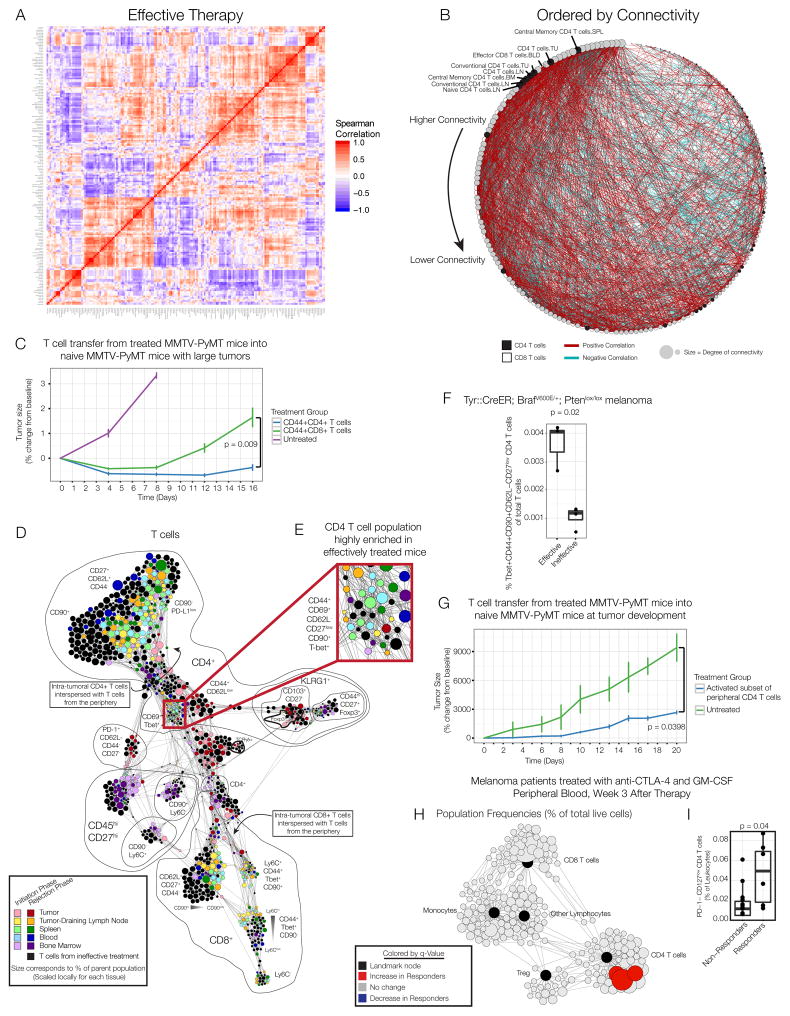
Figure 6. A CD4 T cell subset from the periphery is sufficient to mediate anti-tumor immunity.
(A) Pairwise correlations and hierarchical clustering of immune cell frequencies across organs of mice treated with effective therapy. (B) Adjacency matrix from panel A ordered by connectivity. CD4 T cells in black; CD8 T cells in white. (C) CD44+ CD4 or CD8 T cells from the lymph node, spleen and blood of MMTV-PyMT mice treated with effective therapy were expanded and transferred into treatment-naïve MMTV-PyMT mice (n=3–4 per group). (D) Force-directed graph of T cells from each tissue, time and treatment. Colored by tissue of origin. Light colors indicate initiation phase; dark colors indicate rejection phase. Clusters from mice receiving no or ineffective therapy are black. Node size reflects the frequency of T cells in that cluster as a percent of T cells by tissue. (E) CD4 T cells enriched in the periphery after effective therapy. (F) Frequency of Tbet+CD44+CD62L-CD27low CD4 T cells in the draining lymph node of BP melanoma mice on day 8. (G) CD44+CD62L-CD27low CD4 T cells were isolated from the lymph node, spleen and blood of MMTV-PyMT mice treated with effective therapy. Treatment-naïve MMTV-PyMT mice were sublethally irradiated, and sorted T cells (n=4) or PBS control (n=3) was injected i.v. All p-values reflect two-tailed, heteroskedastic t-tests in R. Error bars represent S.D. (H) Scaffold map of flow cytometry data from blood of melanoma patients treated with anti-CTLA-4 antibodies and GM-CSF, 3 weeks after therapy began. Red nodes are cell subsets significantly expanded in responding patients compared to non-responders. (I) Frequency of CD4+PD-1-CD127low T cells (identified manually) of total leukocytes, analyzed by two-tailed Wilcoxon rank-sum test. See also Fig. S7.

