Figure 3.

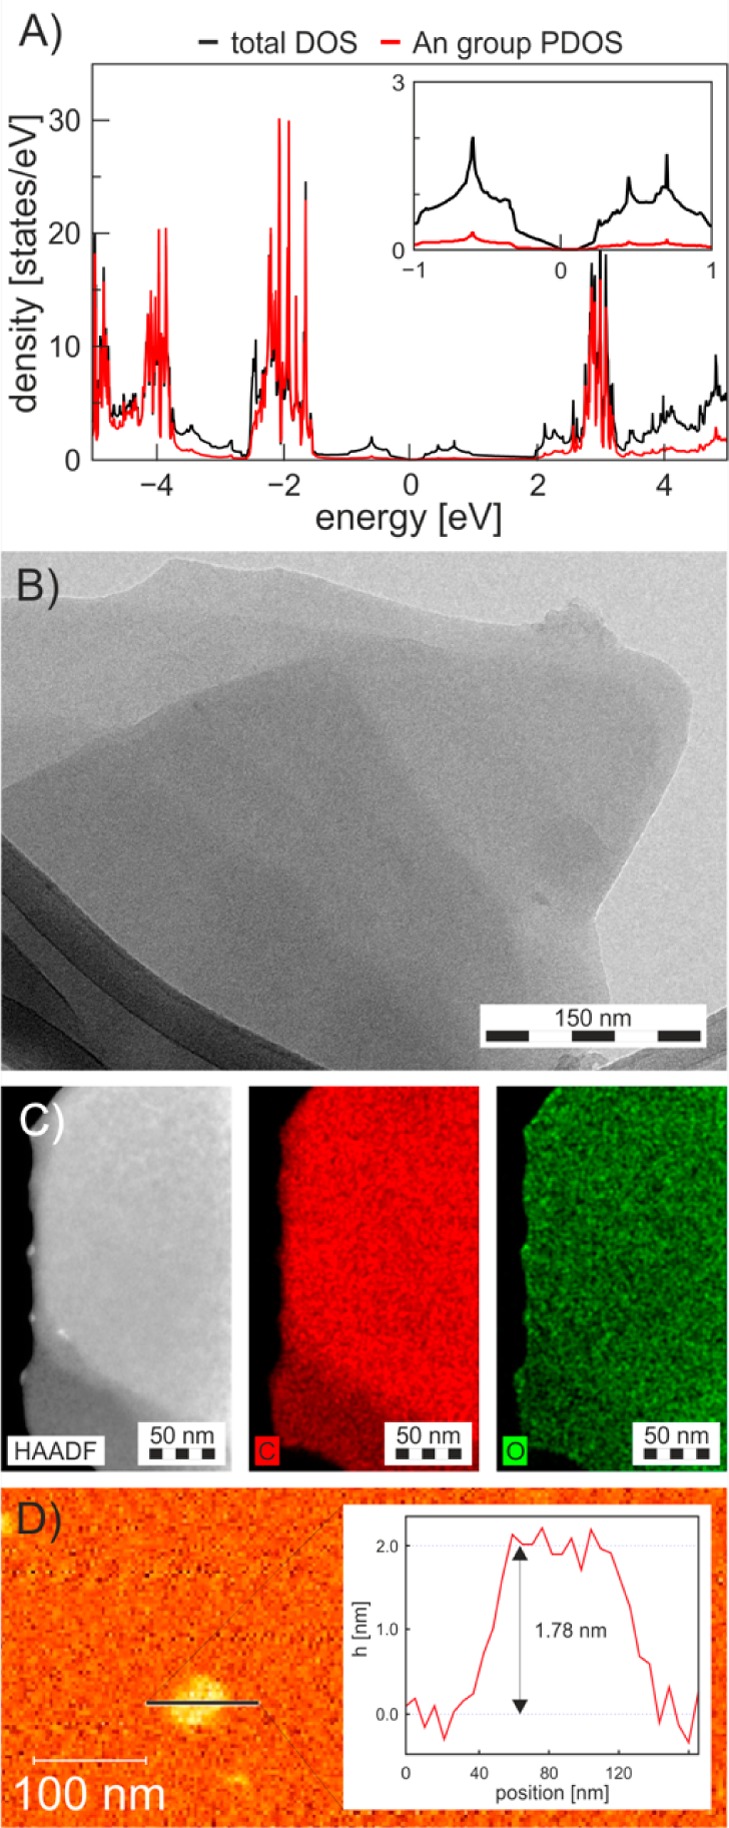
(A) Density of states of AnG. (B) TEM and (C) dark field image with carbon and oxygen EDS maps of AnG flakes. (D) AFM image with the height profile of a typical AnG flake.

(A) Density of states of AnG. (B) TEM and (C) dark field image with carbon and oxygen EDS maps of AnG flakes. (D) AFM image with the height profile of a typical AnG flake.