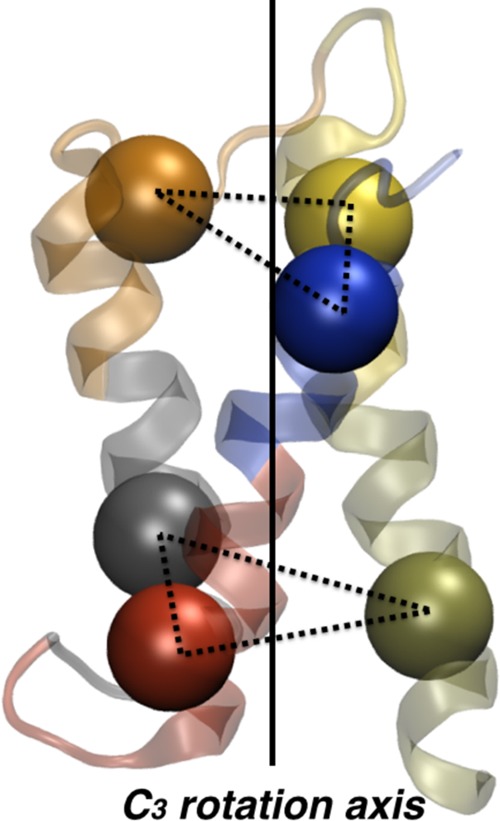
Figure 3.

An example of a symmetric CG map for the protein TMEM14A. The backbone of the atomistic X-ray crystal structure is shown as translucent ribbons. The corresponding CG sites of the mapped structure are shown as solid spheres. The approximate C3 symmetry axis is indicated by a vertical solid line. The geometric planes that flank the molecule in the long (transmembrane) dimension are indicated by dashed-line triangles.
