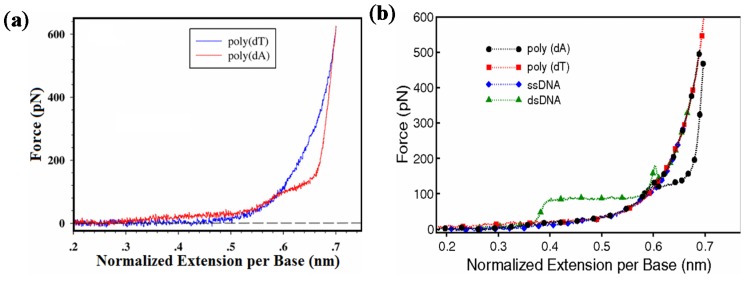
Figure 4.
Force-extension curves for ssDNA. (a) Comparison of pulling curves between poly(dT) and poly(dA). Reprinted with permission from [60]. Copyright (2007) by the American Physical Society; (b) Force-extension curves for different forms of dsDNA and ssDNA. Reprinted with permission from [3]. Copyright (2010) by the American Physical Society.

