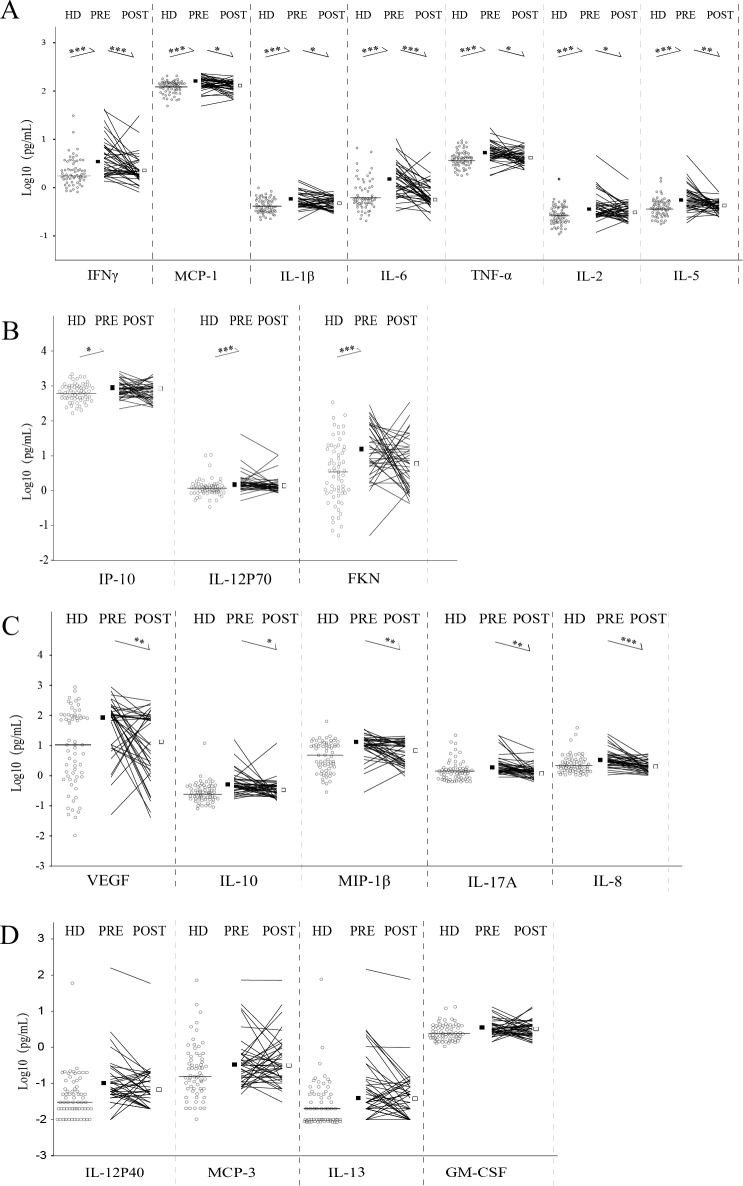
Fig 1. Expression levels of 19 plasma cytokines and chemokines in NPC patients before and after therapy.
A. The ones increasing in NPC patients and declining after therapy. B. The ones increasing in NPC patients but no change after therapy. C. The ones no change in NPC patients but decreasing after therapy. D. The ones no change before and after therapy. Total 39 NPC patients (PRE: pre-treated samples; POST: post-treated samples) and 64 healthy donor (HD). The plasma cytokine/chemokine contents (pg/ml) had been transformed by log 10 to correct the non-normal data. The horizontal line (HD) and squares (PRE and POST) represent the median in each group. *P<0.05; **P<0.01; ***P<0.001.

