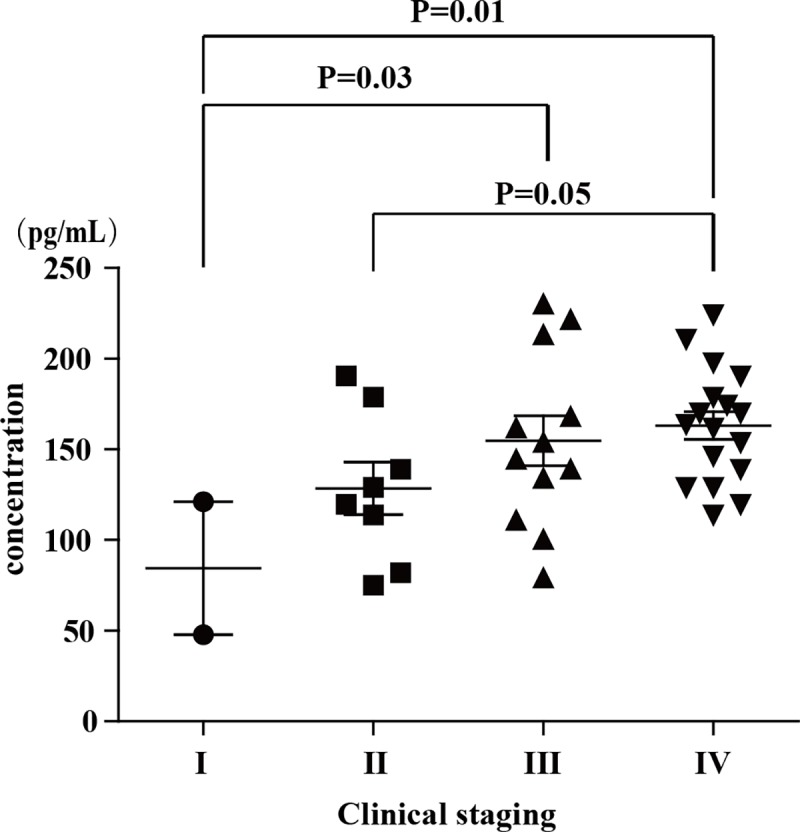
Fig 2. Expression levels of MCP-1 in NPC patients with different stages.

Data was analyzed by one-way analysis of variance (ANOVA). Limited Slip Differential (LSD) post-hoc tests were performed between every two stages. The error bars indicate the mean with the SEM.
