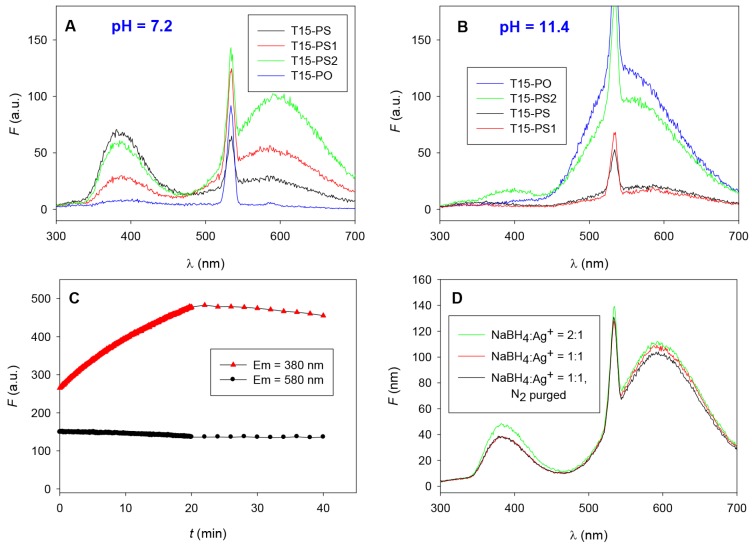
Figure 3.
Emission spectra (λEX 266 nm) of fully-, partially-, and non-phosphorothioate modified T15 DNA template at (A) pH 7.2 and (B) pH 11.4; Samples were prepared using 15 µM DNA, 120 µM AgNO3 and 120 µM NaBH4 in 25 mM phosphate buffer at pH 7.2 or 11.4 and incubated in the dark for 2 hours. Spectra were measured following exposure under a handheld UV lamp at short wavelength for 10 min. Note that an excitation wavelength of 266 nm was chosen for its ability to produce emission from both bands, and favors emission from the yellow-orange band; (C) Emission intensities of T15-PS-templated sample at 380 nm and 580 nm of samples under continuous excitation in fluorescence spectrophotometer at 266 nm using a 20 nm excitation slit and 1 s averaging time, followed by storage in the dark with a 1 s measurement taken every 2 min. UV exposure stopped after 20 min. The sample was prepared using 30 μM DNA, 240 μM AgNO3 and 240 μM NaBH4; (D) T15-PS2, pH 7.2 AgNC samples prepared using different NaBH4 concentrations and the effect of N2 purging to remove oxygen. The sharp peak at 532 nm is due to the low efficiency of monochromators to block light at half frequency of the excitation wavelength.

