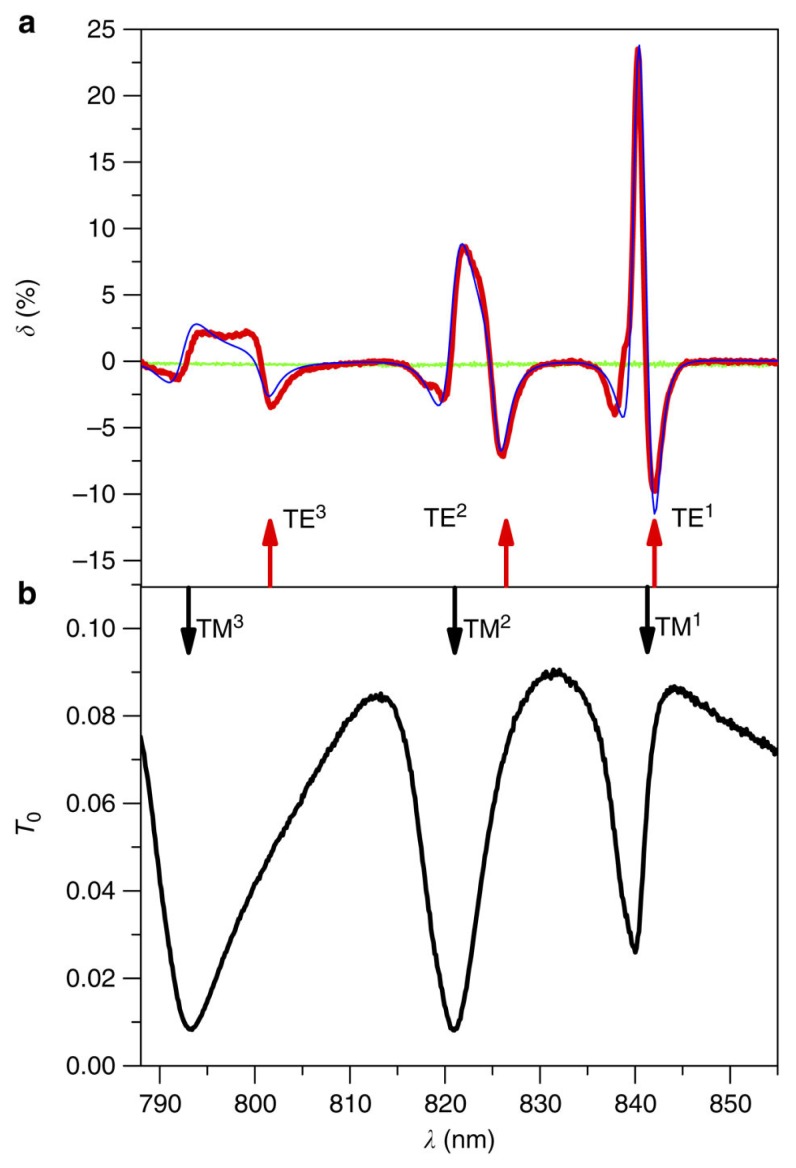
Figure 4.
(a) Spectrum of the LMPIE when a static magnetic field reaching almost the saturation value. Blue curve shows calculated δ. There is no LMPIE for the bare magnetic film (green curve); (b) Spectrum of the optical transmittance for the demagnetised structure. Black and red arrows indicate calculated spectral positions of the quasi-TM and quasi-TE resonances, respectively. The modes are denoted by the number of their Hy or Ey field maxima along the z axis. The light is TM-polarized and hits the sample under normal incidence. Reprinted from [70] with permission by Macmillan Publishers Ltd, Copyright 2013.

