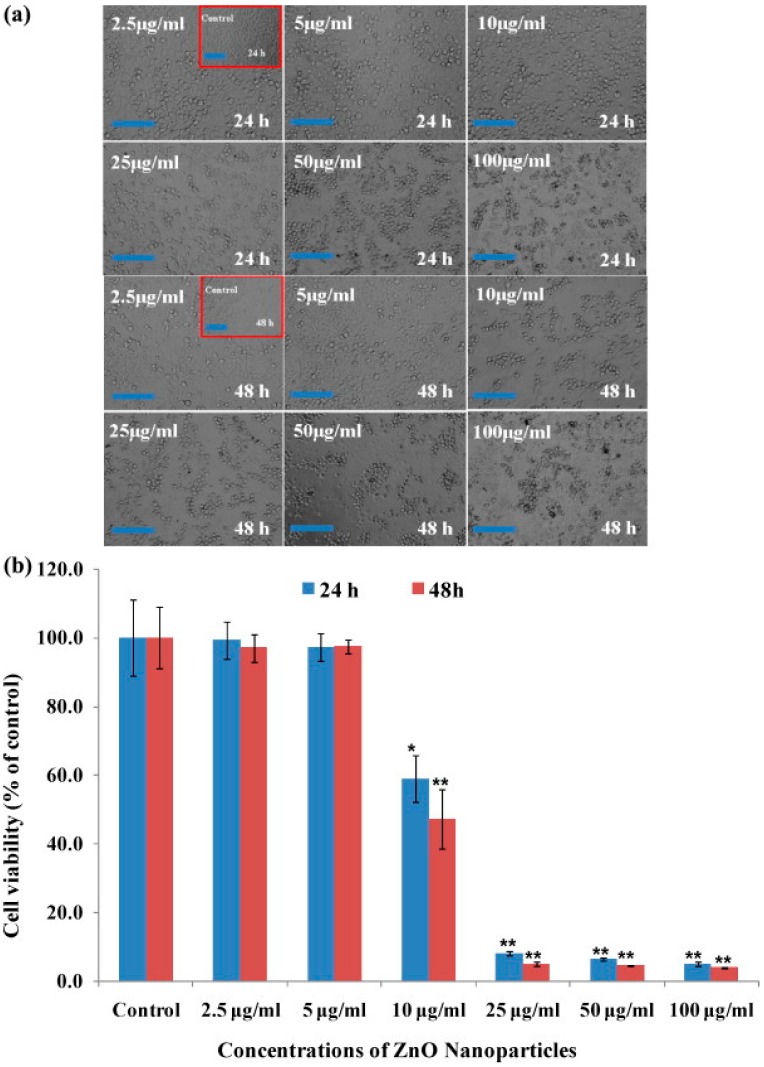
Figure 2.
Microscopic images of HepG2 cells after treatment with ZnO NPs and the mitochondrial activity of cells exposed to various concentration of ZnO NPs for 24 and 48 h. The values are the mean ± SD of three independent experiments. * p < 0.01 and ** p < 0.001 vs. the control group (each scale bar = 1 mm). Reproduced with permission from [38]. Copyright 2014, Elsevier.

