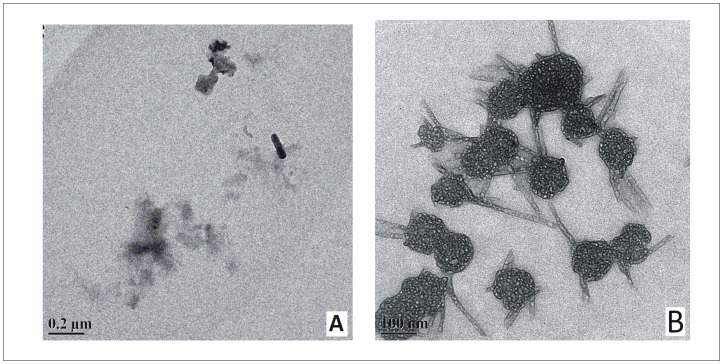
Fig 6. Transmission Electron Microscopy of BSA aggregates formed in the presence of osmolytes.
Representative Transmission Electron Microscopic images of BSA solution after incubation at 333.15 K for a time period of 600 minutes, in the presence of 1.00 M concentration of (A) HPro and (B) GB. Scale bar = 0.2 μm and 100 nm for (A) and (B) respectively.

